Whether you’re at the mall, endlessly scrolling through your favorite ecommerce stores, house-hunting, or shopping for a new car, spending money feels good. That is until you see your balance.
Relying on credit is a life-saver in the modern era, yet a double-edged sword if you’re unaware of the factors that affect your credit score. These eye-opening credit score statistics will show you where you stand compared to the general population and will hopefully help you keep yourself in the favorable range that provides you access to endless credit opportunities at the best terms and rates. Let’s dive in!
Credit Score Statistics (Editor’s Choice)
- The average FICO score in the US is 711 in 2020, and the VantageScore is 688.
- Older generations tend to have better credit scores than younger generations.
- Mississippi is the US state with the lowest average credit score.
- Minnesota has the highest average credit score in the US.
- Homebuyers have a higher average credit score than renters.
- Despite the pandemic, credit card debt decreased in 2020.
- 90% of American adults have a credit card account on their credit score.
- 25% of Americans had a very good score, and 20% had an exceptional score in 2020.
- There were 30.9% American adults with subprime credit scores in 2020.
- Millennials make up the most significant portion of subprime borrowers.
American Credit Statistics
The average FICO score in the US is 711, while the average VantageScore is 688.
Fair Isaac Corp.’s FICO Score and VantageScore are the two most common scoring models among Americans. Both range between 300 and 850, with higher numbers indicating greater financial stability.
(FICO, Experian)
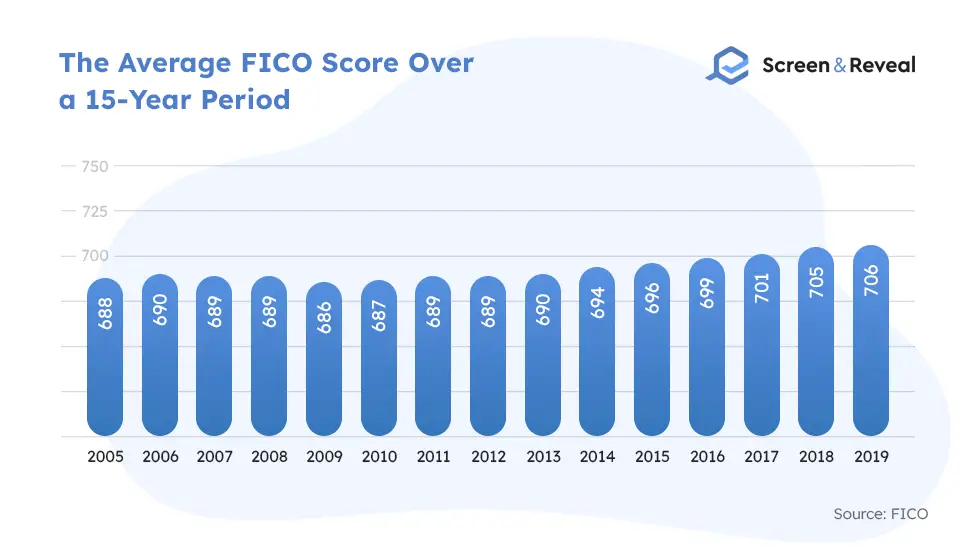
The average FICO score reached an all-time high of 711 in 2020.
Since 2005, 711 is the highest recorded national credit score average, while an all-time low of 686 was recorded in 2009 due to the Great Recession. The average American credit score has fluctuated over the years, hitting higher numbers in times of expansion and declining in times of recession. Contrary to expectations, the COVID-19 pandemic contributed to a higher score despite the economic hardships amid the multiple lockdowns and the global health crisis.
(FICO)
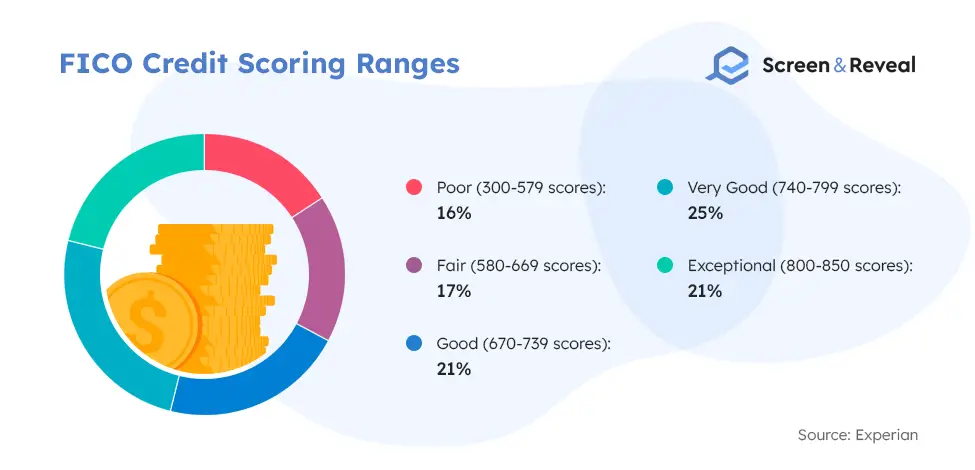
According to the most recent FICO score statistics, approximately 21% of Americans had credit scores that fall into the “good” range.
If we look at the credit scoring ranges by FICO, we can see that the 2021’s national average credit score of 711 falls within the “good” range.
(Experian)
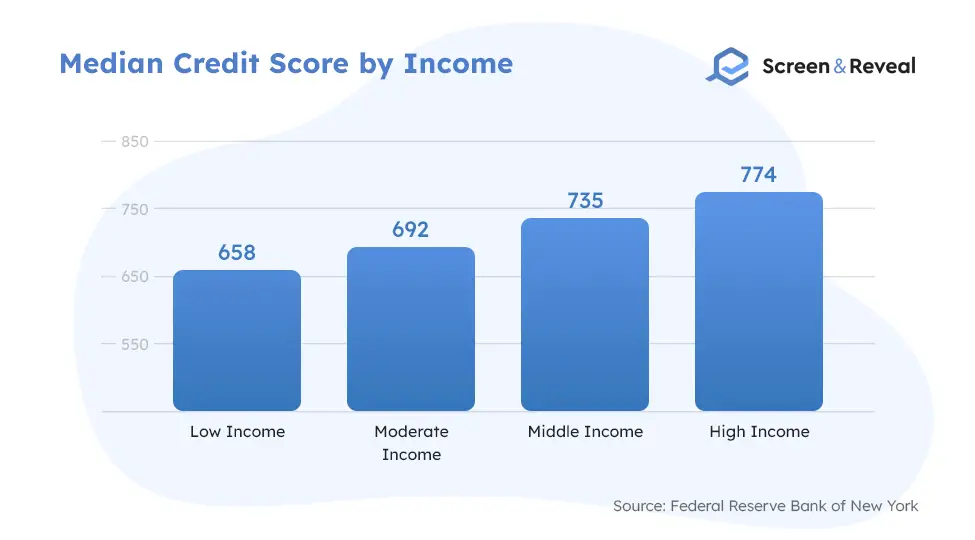
The average American credit score increases with income.
The debt-to-income ratio doesn’t play a significant role in a person’s credit score, yet it impacts it indirectly. Credit utilization is one of the income factors lenders consider when determining one’s credit risk. According to credit statistics, individuals with lower income typically have higher credit utilization. Credit issuers also look at borrowers’ income when determining the available credit amount. The national credit score average by income is shown below.
(Federal Reserve Bank of New York)
Mississippi is the US state with the lowest average credit score (675), while Minnesota boasts the highest (739).
Credit score statistics show that credit scores across all US states increased in 2020. Yet, in the 13 states with the lowest average credit scores, a whopping 40% of the population was considered subprime.
(Experian)
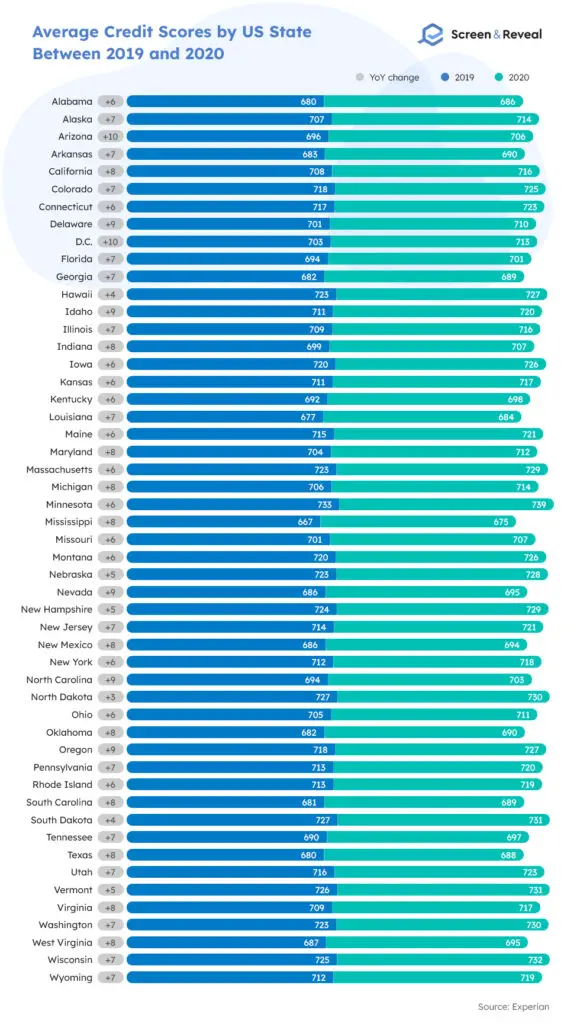
FICO score statistics show North Dakota, South Dakota, Hawaii, Nebraska, and Vermont are the states that saw the least improvement in credit score points from 2019 to 2020.
Growth occurred across all states, but those with the lowest average credit scores experienced the greatest improvements. In 2020, 25 states saw a 7+ point improvement which is the national average rate of increase. The remaining 26 experienced a below-national-average growth in 2020, yet no one was left behind in boosting their credit scores. Even states with historically lower credit score averages saw an improvement that indicates a positive financial trend in the nation.
(Experian)
Credit statistics indicate that homebuyers in the US have a higher average credit score (731) than renters and the national average score (711).
This credit score data is based on homebuyers who took out 30-year, fixed-rate loans in 2020. The District of Columbia held the highest average credit score among home buyers (754), followed by Hawaii (748) and California (741). Homebuyers in Alabama (713), Michigan, and New Mexico (both 718) had the lowest average credit scores.
As an increasing number of landlords partner with tenant screening companies, renters must be mindful of their credit scores. Tenant screening background checks often include a credit report, among other things, that landlords use to determine whether applicants can meet their rental obligations. In extreme cases, people end up being homeless because of bad credit, as no landlord finds them trustworthy.
(ValuePenguin)
American consumers have seen their average credit card balance drop by 14% since 2019.
That’s an average $879 decrease since 2019, which marks the first fall in personal credit card debt since 2011. The decline could be attributed to factors like mandatory lockdowns and business closures which have lowered consumerism, and the government’s economic stimulus measures.
(Experian)
According to credit score statistics, the states with the highest balances experienced the most significant decrease in credit card debt.
The average credit card balance dropped across the entire country, shrinking at around the national average rate of 14%. Interestingly, locations with higher balances like Washington D.C. have seen debt shrinking by 20%, while in states with lower balances like North Dakota, credit card debt has shrunk by only 8%.
(Experian)
In 2020, the average credit utilization ratio reached its lowest (25%) in the past decade.
Credit statistics show that the credit utilization ratio went from 29% in 2019 to 25% in 2020, a 4% drop marking the lowest point in the past 10 years. Credit utilization is the second most significant factor that impacts one’s credit score. It determines the available credit consumers are using on their credit cards at a given time. If you want to get better rates and terms when applying for credit, you should work on reducing your utilization.
(Experian)
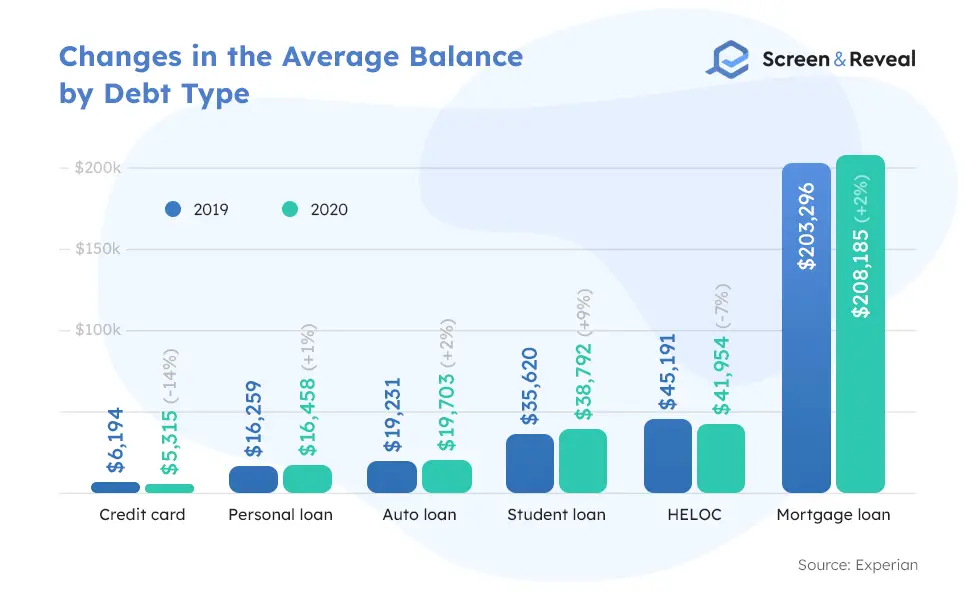
Credit card debt saw the biggest drop in 2020, while student loan debt noted the highest increase, credit score statistics show.
Credit card debt saw the most dramatic change of all categories, recording 14% decrease. Student loan debt, on the other hand, increased by 9%. There were also increases in mortgage debt, personal loan, and auto loan.
(Experian)
The average credit card utilization decreased by 12% between 2019 and 2020.
The average number of ever delinquent consumer accounts also dropped by 10%. These two changes, along with the fall in debt, have significantly improved the nation’s credit health. Before getting too optimistic about the future, you should consider that this data was collected during a turbulent period and may dramatically change as the COVID-19 pandemic unfolds.
(Experian)
88% of businesses rely on owners’ personal credit scores to secure financing.
As many as 56% of owners have relied on their personal savings, friends, or family to support their businesses.
(Fed Small Business)
Credit Score Demographics
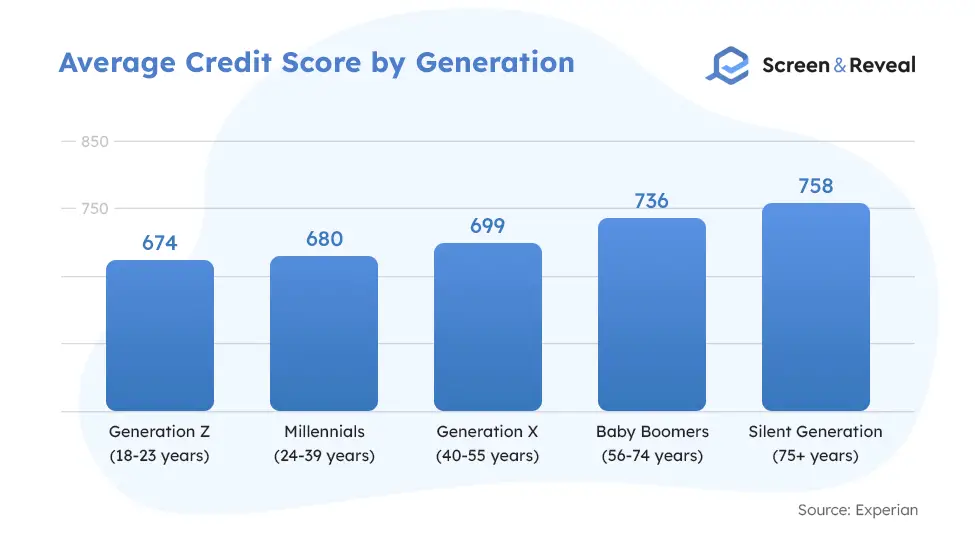
Credit score statistics show that the higher the age, the better the FICO credit score.
If we look at the average credit score by age, Generation Z (aged 18–23) has the lowest at 674 by FICO. Younger generations struggle to start building a credit score in the first place. A big part of the problem is the 2009 CARD Act, which makes it harder for 18-to-21-year-olds to open new credit card accounts. Millennials (aged 24–39) have a FICO score of 680 due to significant expenses typically occurring at this point in their lives, like weddings, first mortgages, etc. Standing at 699, Generation X (aged 40–55) shows greater financial stability, followed by Baby Boomers (aged 56–74) and the Silent Generation (aged 75+) with the highest FICO.
(Experian)
According to FICO score statistics, Americans of all generations improved their FICO score in 2020, with Millennials seeing the biggest rise in points.
The improvements in FICO credit score by generation are as follows:
- Generation Z (18–23) +7 points
- Millennials (24–39) +11 points
- Generation X (40–55) +10 points
- Baby Boomers (56–74) +5 points
- Silent Generation (75+) +1 point
(Experian)
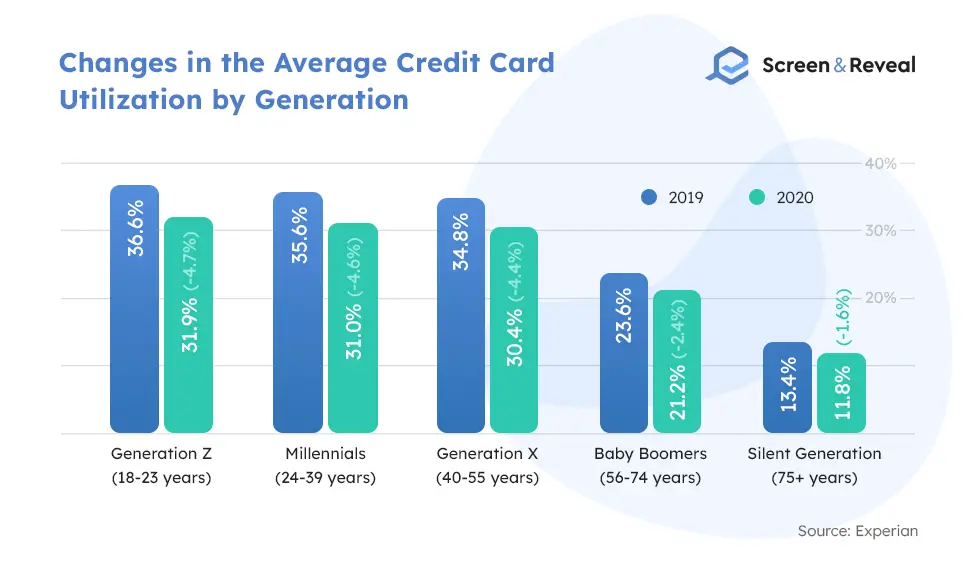
Younger generations did better at reducing their credit utilization in 2020.
During the peak pandemic period, younger generations were able to pay down their balances. While every age group managed to reduce their credit utilization, Generation Z, Millennials, and Generation X showed better progress than older generations.
(Experian)
Credit score statistics show that Americans of all generations have reduced their credit card balances in 2020.
Individuals of all generations use credit cards, yet in different ways. People belonging to younger generations like Gen Z and Millennials typically have lower balances and lower credit limits, resulting in higher credit utilization. Older generations, on the other hand, tend to have higher balances on their credit cards with higher credit limits as they utilize less of their available balance.
(Experian)
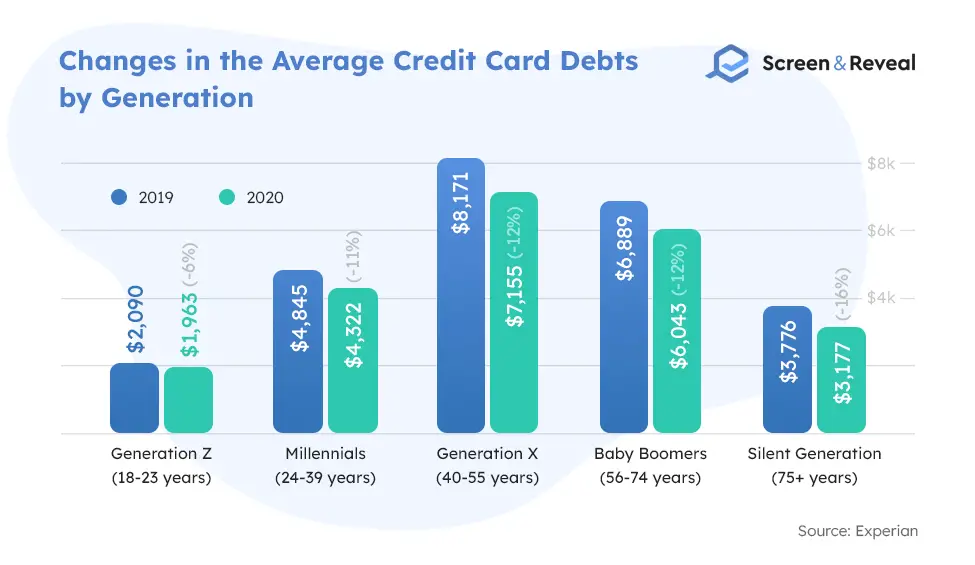
Individuals of older generations reduced their credit card debt at a higher rate than younger Americans in 2020.
Credit statistics indicate that the Silent Generation (75+) has experienced the greatest decrease in credit card debt (16%), while Generation Z (18–23) only saw a 6% decrease during the same year.
(Experian)
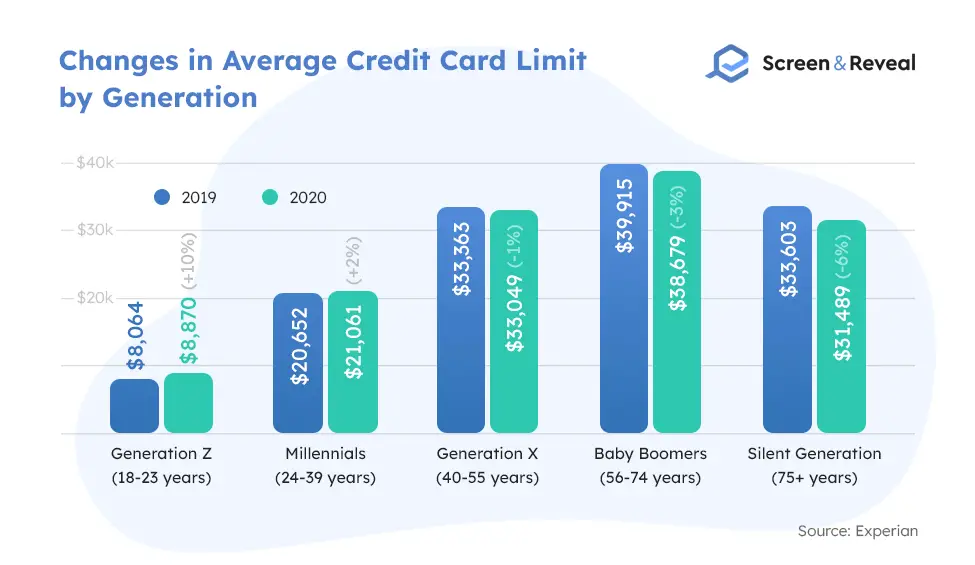
In 2020, younger generations increased their average credit card limit, resulting in a boost in their credit scores.
If we look at the credit score percentile by age, Gen Z (18–23) and the Millennial generation (24–39) increased their average credit limit by 10% and 2%, respectively. Generation X (40–55) has decreased their credit card limit by 1% on average. Baby Boomers’(56–74) and the Silent Generation (75+) have also decreased their limits.
(Experian)
Bad Credit Score Statistics
The portion of individuals with subprime credit scores fell in 2020.
The percentage of consumers with subprime credit scores (below 670) went from 33.8% in 2019 to 30.9% in 2020. The nearly 3% point drop might seem insignificant but it’s three times the 1% improvement seen between 2018 and 2019. The average FICO credit score among subprime consumers rose from 578 to 583 in 2020, aligning with the national growth. It’s a highly positive trend that has allowed those with the least credit access to gain new credit opportunities.
(Experian)
Bad credit statistics unveil that subprime and prime consumers rely on different types of debt.
Subprime consumers tend to have more personal and student loans, while prime consumers rely on mortgage and credit card accounts. Subprime consumers have twice as many personal loan accounts as prime consumers. Auto loans and HELOCs are the only types of debt with a similar prevalence among both subprime and prime consumers.
(Experian)
In 2021, all US states saw a decline in subprime borrowers.
Most states saw a decline between 7% and 14%. Washington outperformed with a 16% decline in subprime users, followed by Maryland and Oregon with a 15% decline each.
(Experian)
Bad credit score statistics show that Millennials make up the most considerable portion of subprime borrowers.
Millennials comprise a whopping 40% of subprime consumers, according to 2021 credit score data. Although quite a large portion of the overall subprime population, Millennials’ presence has dropped by 11% since Q1 in 2020. The Silent Generation has the highest average credit score and makes up the smallest portion of subprime borrowers. Older generations had more time to build their credit scores, which has yielded better results.
(Experian)
Bad credit statistics unveil that borrowers in low-income areas are responsible for only 16% of the nation’s total debt.
The total debt in middle and high-income areas was $11.8 trillion in 2020, while the total debt in lower-income regions accounted for only $2.2 trillion. Individuals in higher-income areas have $65,400 of debt per adult, compared to $32,167 of debt/adult in lower-income places.
(Experian)
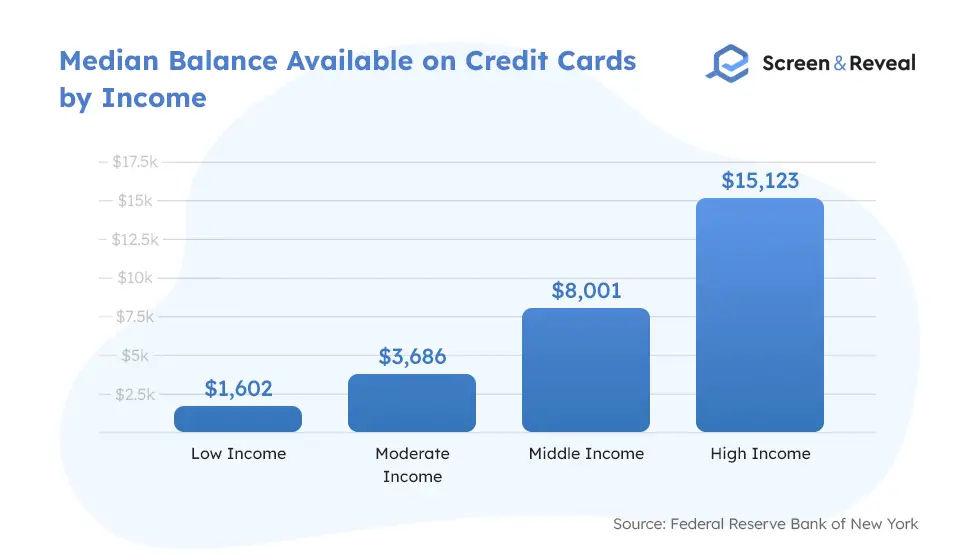
Individuals with high income have $15,123 median balance available on their credit cards.
Low income individuals, on the other hand, have a $1,602 median balance on their credit cards. Middle income earners in the US have on average $8,001 available on their credit cards.
(Federal Reserve Bank of New York)
Bad credit score statistics show that 26 million American adults were credit invisible in 2010.
While there’s a lack of new data on the subject, 2010 data from the Consumer Financial Protection Bureau indicates that 11% of the adult American population were invisible to the traditional avenues of building credit. An additional 19 million or 8.3% of the adult population were considered unscorable by the commercially available credit scoring models. Of those 19 million, 9.9 million were unscored due to insufficient credit, and 9.6 million due to lack of recent history. The majority of credit invisible consumers or those with unscored records come from low-income neighborhoods. Most consumers that don’t have a credit history or are unscorable are usually very young, and they still have the time to build their report.
(CFPB)
According to bad credit statistics, Black Americans and Hispanics are more likely than white Americans or Asians to have unscored credit records or to be credit invisible.
Approximately 15% of Blacks and Hispanics are credit invisible compared to only 9% of whites and Asians. Additionally, 13% of Blacks and 12% of Hispanics have unscored records compared to only 7% of whites.
(CFPB)
Despite the economic downturn due to the COVID-19 pandemic, business bankruptcy filings fell 11.8% between June 2019 and June 2020.
The annual bankruptcy filings totaled 773,361 in June 2019, compared to 682,363 a year later. Non-business bankruptcy filings also fell by 12.1%, going from 750.878 to 659.881 over the same period. Business filings meanwhile remained the same as the previous year, totaling 22.482.
(US Courts)
Credit score knowledge statistics indicate that those with low incomes struggle to answer consumer knowledge questions correctly.
A survey conducted by the Consumer Federation of America revealed that 20% of households earning below $25,000 intended to apply for credit in the next year, compared to 13% of those with incomes of $75,000 or higher. Yet, about a quarter of those with low incomes lack the knowledge to help them improve their credit scores, which could lead to limited access to credit or higher costs to obtain one.
(CFA)
Credit score knowledge statistics show 43% of consumers didn’t check their credit score reports in 2018.
On the bright side, credit awareness seems to be rising. In 2014, 49% of consumers obtained their credit reports, compared to 57% in 2018. Credit repair statistics indicate that a whopping 40% of consumers have a mistake on their credit report, which can cost them credit opportunities and better overall terms. That’s why it’s a good idea to get your credit report regularly, even if you’re not currently a borrower.
(CFA)
There’s a new victim to identity theft approximately every two seconds.
In this digital era, almost everyone has shared personal information somewhere on the web. As identity theft and financial frauds are on the rise, many people turn to credit monitoring services to keep their credit scores in check. These services will immediately alert you of any changes in your score, so you can promptly react if someone’s after your personal information.
(LifeLock)
Credit Score Distribution Statistics
Bad credit statistics unveil that 16% of Americans have a poor credit score.
When it comes to the distribution of credit scores, data from 2019 indicates that 16% of Americans have a poor one, meaning almost no access to credit opportunities. Younger generations tend to have poor results simply because they didn’t have enough time to build a good credit score. These cases are not as bad as it seems since youngsters have plenty of time to catch up.
(Motley Fool)
18% of American adults have what’s considered a “fair credit score.”
According to FICO score statistics, individuals whose credit falls between 580 and 669 have a fair credit score, another far from ideal situation. Like the previous one, this group is considered high-risk borrowers that lenders will most likely deny a loan to. And even if their application gets approved, the interest rates and insurance premiums will be higher, with deposits required. In a nutshell, it’s not a promising financial future. Individuals in this situation, therefore, should consider credit repair services or work on improving their credit score on their own.
A low credit score might also get in the way of securing a job as more employers ask the pre-employment background check companies to include candidates’ credit reports. While they can’t see the exact score, these reports show financial history chronicles. Those applying for jobs in finance, jobs that involve handling sensitive data, and higher-level positions are expected to have a good credit score.
(Motley Fool)
According to credit score statistics, 21% of Americans have a good credit score (670–739).
Getting your credit score above 670 is where you want to be before applying for any type of loan. Individuals in this group enjoy lower interest rates and, in most cases, can avoid deposits altogether.
(Motley Fool)
A quarter of the adult US population has a perfect credit score.
If your score is anywhere between 740 and 799 by FICO, you’re part of a financially sound group with an abundance of credit opportunities. Let’s look at the distribution of credit scores by range. We can see that most Americans belong in the “very good credit score” category. Typically, those with scores over 760 get access to the best terms and lowest interest rates, something you need to keep in mind if you’re on the lookout for the best credit deal.
(Motley Fool)
Credit statistics show that 20% of American adults have an exceptional credit score.
The credit score elite stands between 800 and 850 points by FICO. People in this group are among the top applicants with endless credit opportunities. This doesn’t mean a 100% chance of approval for any loan. Still, members of the exceptional credit club will rarely get denied. And what about people with a perfect credit score of 850? Are these unicorns even real? Credit score data shows 1.2% of American adults belong to the impressive 850 FICO score club. Credit scores, however, are subject to change, meaning that the percentage of the population with a credit score over 800, even those who are currently at 850, won’t stay there indefinitely.
(Motley Fool, Experian)
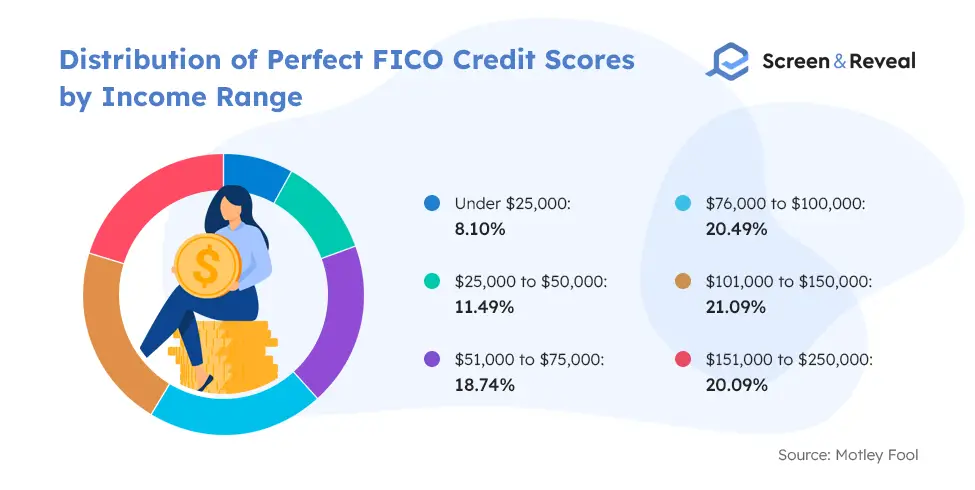
FICO score statistics show that individuals making $101,000 to $150,000 a year are most likely to have a perfect FICO score.
A perfect FICO score is not exclusive to millionaires. As long as you pay your bills on time, keep your credit utilization low, have a long credit history with various credit accounts, and open new credit accounts mindfully, you can build a perfect FICO score, credit score statistics confirm. In 2018, 38% of the people with a perfect credit score were making $75,000 or under a year.
(Motley Fool)
Data on the average credit score by race indicates that Asians have the highest credit score (745) of all races.
The Black population, on the other hand, has the lowest average score at 677. Whites have an average score of 734, while other races stand at 732.
(Shift Processing)
Credit Score Statistics by Debt Type
22% of American adults have a personal loan.
The average FICO score for individuals with a personal loan in 2020 was 689. A personal loan has grown at the slowest pace this year, up only 1%, compared to 12% in 2019. It’s a popular form of debt, with one-quarter of American adults having a personal loan.
(Experian)
62% of American adults have an auto loan debt.
An auto loan is the second most popular type of debt among Americans, with half of the population having it on their credit reports. Americans with an auto loan had a FICO score of 712 on average in 2020.
(Experian)
Credit statistics indicate that 14% of US adults have a student loan debt on their credit reports.
Student loan debt saw the most dramatic spike in 2020, growing by 9% on average. This significant change comes from the suspension of federal student loan repayment, part of the CARES Act that was designed to offer economic relief to Americans during the COVID–19 pandemic. The FICO score for individuals with student loan debt was 689 on average in 2020.
(Experian)
HELOC debt appears on the credit reports of 12% of American adults.
Individuals with HELOC (home equity line of credit) debt saw their balances decrease by 7% in 2020. These consumers had the highest average score in the same year, 777, nearly 70 points higher than the national average credit score.
(Experian)
According to credit score statistics, 44% of the adult US population has mortgage debt.
Mortgage debt comprises the largest outstanding debt among Americans, recording a 2% growth in 2020. US adults still bought homes in 2020, partially due to lower interest rates that occurred as a result of the decline in economic activity during the pandemic. The average score for those with mortgage debt was 753 in 2020, more than 40 points higher than the national average credit score.
(Experian)
After nearly a decade of constant growth, credit card debt decreased in 2020.
Credit score statistics show that this significant consumer debt category had shrunk for the first time since 2013. Quite surprisingly, it happened during the COVID-19 pandemic when many were and still are struggling with their finances. For eight consecutive years, consumer debt was rising, reaching an all-time high of $829 billion in 2019. In an unexpected turn of events, outstanding credit card debt fell by 9%, totaling $756 billion.
Yet, it’s not all rainbows and butterflies. It seems that the government’s debt relief initiatives have a lot to do with Americans paying down their balances. From the suspension of student loan payments to one-time stimulus checks, the federal economic stimulus measures by the CARES Act have helped Americans improve their credit score, at least to some extent.
(Experian)
Credit statistics show American consumers have opened 12 million new credit card accounts since 2019.
The number of credit card accounts went from 485 million in 2019 to 497 million in 2020. While those are fewer than the nearly 21 million new accounts added in 2019, given the economic hardships, this still represents significant growth. Interestingly, for the first time in 14 years, consumers opened new accounts but lowered their debt. Past trends indicate that new accounts create spikes in debt. It seems that in 2020, consumers were focused on paying down their debt and weren’t using their new cards for purchases.
(Experian)
Credit score statistics show that late and missed payments for credit card accounts decreased in 2020.
The percentage of delinquent accounts across all time periods decreased for the first time after five years of consistent growth. Accounts 30–59 days past due have seen the most significant decrease of 33%, followed up by a 31% drop in delinquency for accounts 60–89 days past due and a 24% decrease in failure for accounts 90–180 days past due.
(Experian)
90% of American adults have a credit card account on their credit score.
The average FICO score for individuals with a credit card balance in 2020 was 735. Credit statistics show that more than 90% of the American adult population has a credit card account on their credit report as it’s the most popular type of debt. Additionally, 75% of American adults have a credit card balance greater than $0.
(Experian)
FAQ
How many Americans have bad credit?
There are 30.9% American adults with credit below 670 in 2020, a range considered subprime by the FICO scoring model.
What percent of Americans know their credit score?
According to credit score statistics, in 2018, 57% of American adults obtained their credit score report.
What percentage of the population has a credit score over 800?
A credit score in the range of 800 and 850 by FICO is the highest possible score. 20% of American adults have an exceptional credit score over 800, up to 850.
What percentage of the population has a credit score over 700?
59% of American adults had a FICO score of above 700 in 2019, the largest percentage ever for this category.
What is the average credit score?
The most popular scoring models in the US are FICO and VantageScore. The average FICO credit score in the US in 2020 was 711, and the average VantageScore was 688.
What is the average credit score for a 25-year-old?
FICO score statistics show that the average credit score for a 25-year-old is 659.
What is the average credit score for a 30-year-old?
The average score for a 30-year-old is 663.
What is the average credit score by state?
The credit score average in 2020 by state is as follows:
- Mississippi – 675
- Louisiana – 684
- Alabama – 686
- Texas – 688
- Georgia – 689
- South Carolina – 689
- Arkansas – 690
- Oklahoma – 690
- New Mexico – 694
- Nevada – 695
- West Virginia – 695
- Tennessee – 697
- Kentucky – 698
- Florida – 701
- North Carolina – 704
- Arizona – 706
- Indiana – 707
- Missouri – 707
- Delaware – 710
- Ohio – 711
- Maryland – 712
- District of Columbia – 713
- Michigan – 714
- Alaska – 714
- California – 716
- Illinois – 716
- Kansas – 717
- Virginia – 717
- New York – 718
- Rhode Island – 719
- Wyoming – 719
- Idaho – 720
- Pennsylvania – 720
- Maine – 721
- New Jersey – 721
- Connecticut – 723
- Utah – 723
- Colorado – 725
- Iowa – 726
- Montana – 726
- Hawaii – 727
- Oregon – 727
- Nebraska – 728
- Massachusetts – 729
- New Hampshire – 729
- North Dakota – 730
- Washington – 730
- South Dakota – 731
- Vermont – 731
- Wisconsin – 732
- Minnesota – 739
Is 820 a good credit score?
Credit score statistics indicate that 820 is an excellent credit score. Everything between 800 and 850 by FICO is considered exceptional.
Does anyone have an 850 credit score?
Yes! 1.2% of American adults have a perfect FICO score.
How rare is a perfect credit score?
A perfect credit score is extremely rare as many factors can quickly remove points from your score, even if it’s a mistake. Only 1.2% of the American adult population has a perfect score of 850.
Does anyone have a 300 credit score?
Both the FICO and Vantage scoring models range between 300 and 850, meaning that 300 is the lowest possible credit score. Although it’s rare for someone to have the lowest credit score of 300, many Americans struggle with bad credit. Credit score statistics show that 30.9% have a credit score below 670.
Sources: FICO, Experian, Experian, Federal Reserve Bank of New York, Experian, Experian, ValuePenguin, Experian, Experian, CFPB, US Courts, CFA, CFA, LifeLock, Motley Fool, Experian, Motley Fool, Shift Processing, Motley Fool, Experian.