The US incarcerates more people than any other country in the world, keeping nearly 2.3 million locked in federal and state prisons and jails. Crime rates have little to do with the rise of the prison population in the last four decades in the US. What happened between 1980 and now for the prison population to rise by 500%? Is it to keep the general public safe? Dive into these detailed incarceration statistics to get a big picture view of why the land of the free keeps so many people behind bars.
Incarceration Statistics (Editor’s Choice)
- The US holds the highest imprisonment rate globally, locking 639 people per 100,000. (The Sentencing Project)
- There are roughly 2.3 million people behind bars in the United States. (Prison Policy Initiative)
- Over the last 40 years, the prison population in the US has grown by 500%. (The Sentencing Project)
- The US spends over $80.7 billion a year to keep Americans locked in public prisons and jails. (Prison Policy Initiative)
- The total annual spend on private prisons and jails is $3.9 billion. (Prison Policy Initiative)
- An estimated 4,000+ companies profit from the mass incarceration of Americans. (Prison Policy Initiative)
- In the US, families of incarcerated people spend roughly $2.9 billion+ a year on prison phone calls and commissary purchases. (Prison Policy Initiative)
- Over 27% of formerly incarcerated people are unemployed. (Prison Policy Initiative)
- Incarcerated workers make an average of $0.86+ a day. (Prison Policy Initiative)
- Each incarcerated person loses an average of $500,000+ in earnings over their lifetime. (Prison Policy Initiative)
1. US Mass Incarceration Statistics
The US is the worldwide leader in both incarcerations per 100,000 of the population and the number of prisoners in 2020. The incarceration rate stateside is 15 times higher than in Japan, nine times higher than Germany, eight times higher than Italy, and five times higher than the UK. Other countries with comparable population sizes like China have far fewer prisoners than the United States.
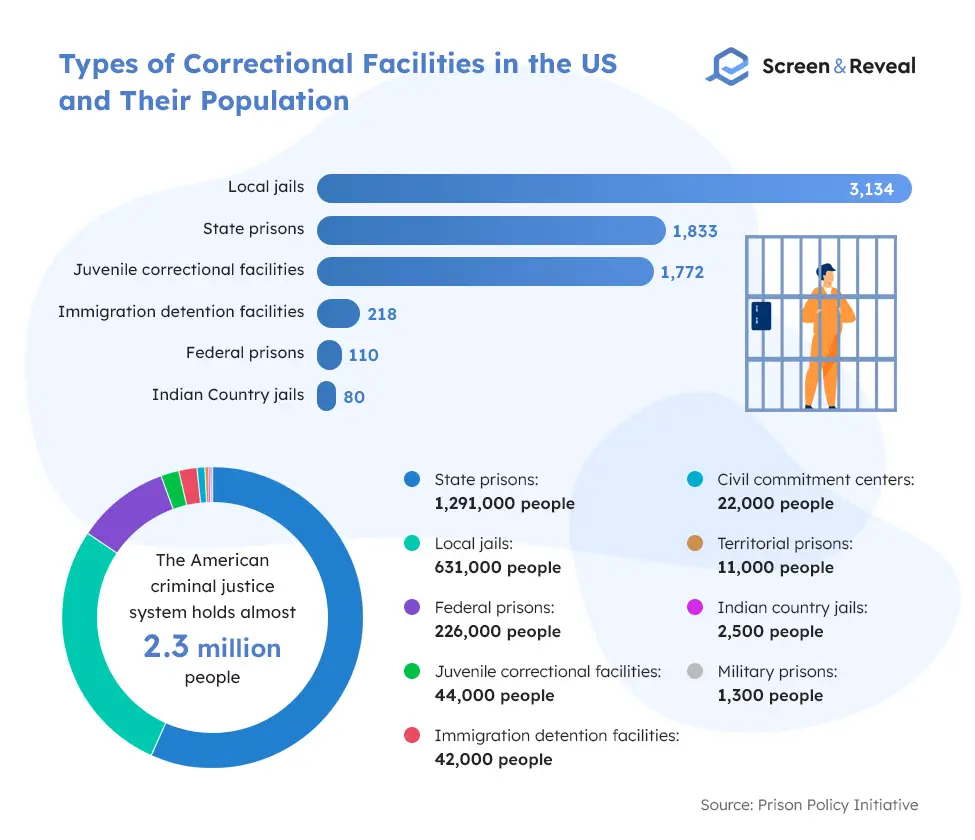
Statistics on incarceration suggest that the US is the biggest incarcerator globally, with 639 prisoners per 100,000 of the population. The American criminal justice system keeps nearly 2.3 million people locked in public prisons. A small part of the incarcerated population is locked in military prisons, other prisons in the US territories, state psychiatric hospitals, and civil commitment centers.
(Brennan Center for Justice, The Sentencing Project, Prison Policy Initiative)
1.1. US Mass Incarceration Background
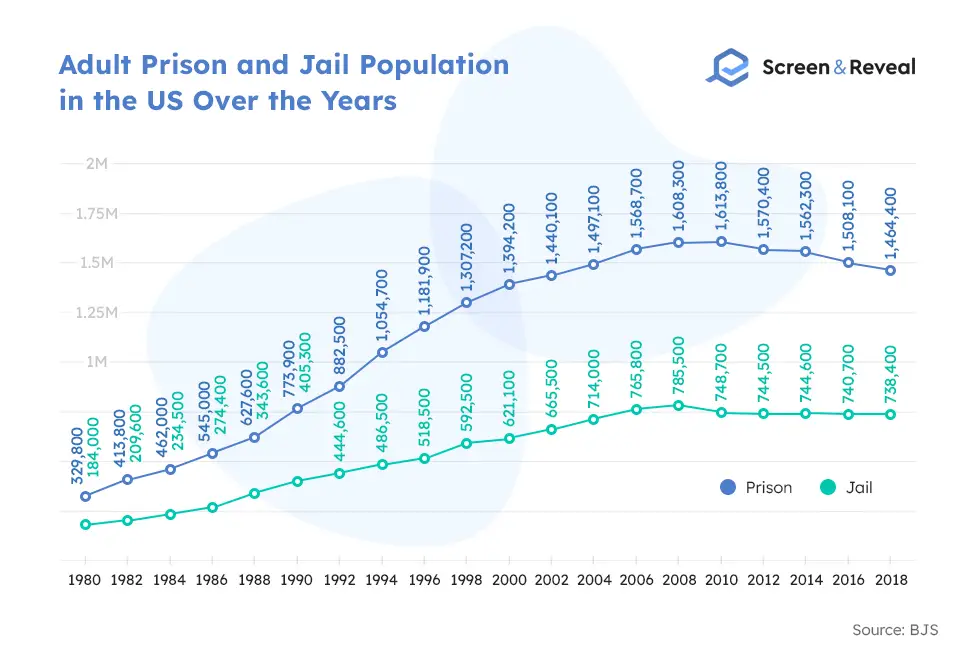
It all started in the 1970s when politicians from both parties used fear and racial rhetoric while promoting their severely punitive policies. President Nixon pioneered this trend declaring “war on drugs,” popularizing the idea through his speeches. During President Ronald Regan’s administration, the prison population spiked dramatically, going from 329,800 in 1980 when he stepped into the presidential role to 627,600 eight years later, when he left office.
US incarceration statistics show that the imprisoned population has grown by 500% over the last forty years, but the rise in crime rates has not caused the dramatic boost. The changes in law and policy and a one-size-fits-all approach to all crimes have caused overcrowding in prisons and increased fiscal burdens on states.
The Brennan Center analyzed convictions and sentences for 1.46 million prisoners nationally, reporting that 39% of those or 576,000 people are imprisoned without any public safety reason. These people could’ve been sentenced to community service instead, which is cheaper and less damaging.
The US punishment system is known for inflicting severe sentences, disproportionately affecting minorities, and lacking a public safety rationale. Every year, people go to jail a whopping 10.6 million times, and over 600,000 people end up in prison. US incarceration statistics show that mass incarceration has hit the communities of color the hardest and continues to do so.
Jail churn has reached staggering heights because most people that end up in jail haven’t actually been convicted. Only about 160,000 on any given day have been convicted, primarily for misdemeanors, serving under-a-year sentences. A small portion can make bail, but most of them are too poor to afford it, so they have no other choice than wait for their trial behind bars. At least one in four people who went to jail will be arrested again within the same year, mostly because of substance use disorders, poverty, and mental illness, which only worsen with imprisonment.
(Brennan Center for Justice, The Sentencing Project, Prison Policy Initiative)
2. Incarceration Statistics by Race
- The incarceration rate for African Americans in state prisons is approximately five times the incarceration rate of whites. (The Sentencing Project)
- Iowa, California, Connecticut, Maine, Minnesota, New Jersey, and Wisconsin have an incarceration disparity of more than 10 to one. (The Sentencing Project)
- In Alabama, Georgia, Illinois, Virginia, Delaware, Louisiana, Mississippi, Maryland, Michigan, New Jersey, North Carolina, and South Carolina, over half of the prisoners are Black. (The Sentencing Project)
- African American incarceration statistics show that Maryland tops the nation with a 71% Black prison population. (The Sentencing Project)
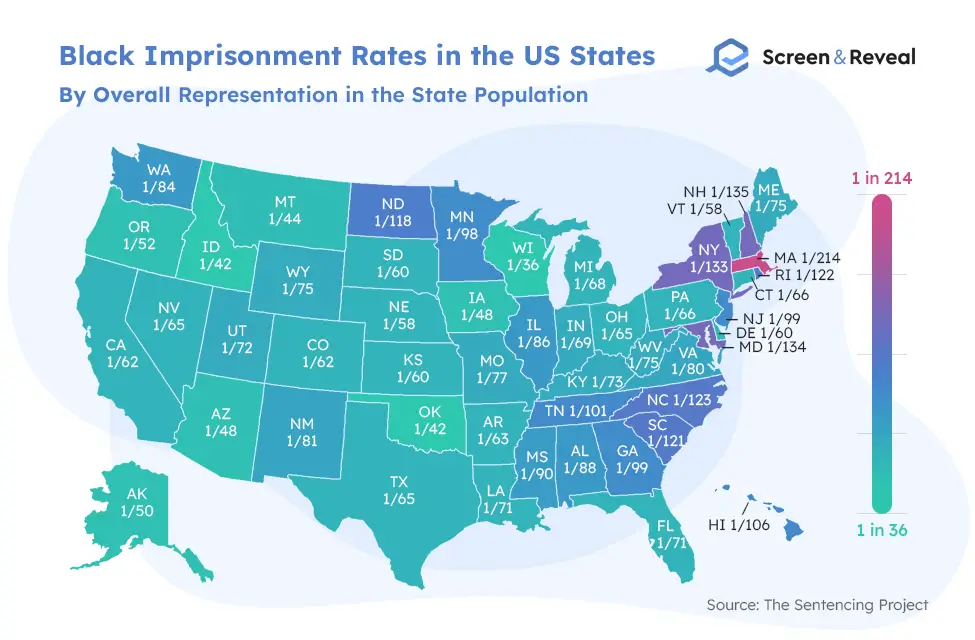
- Wisconsin has the highest overall Black imprisonment rate, incarcerating one in 36 Black individuals. (The Sentencing Project)
- Even in Hawaii, a state with the lowest racial disparity, Black individuals have twice as high chances to get incarcerated compared to whites. (The Sentencing Project)
2.1 Overrepresentation of People of Color in American Prisons
That means racial and ethnic disparity is very present in US prisons, resulting in higher incarceration rates among people of color. African American incarceration statistics show that in 12 states, African Americans account for more than half of the prison population.
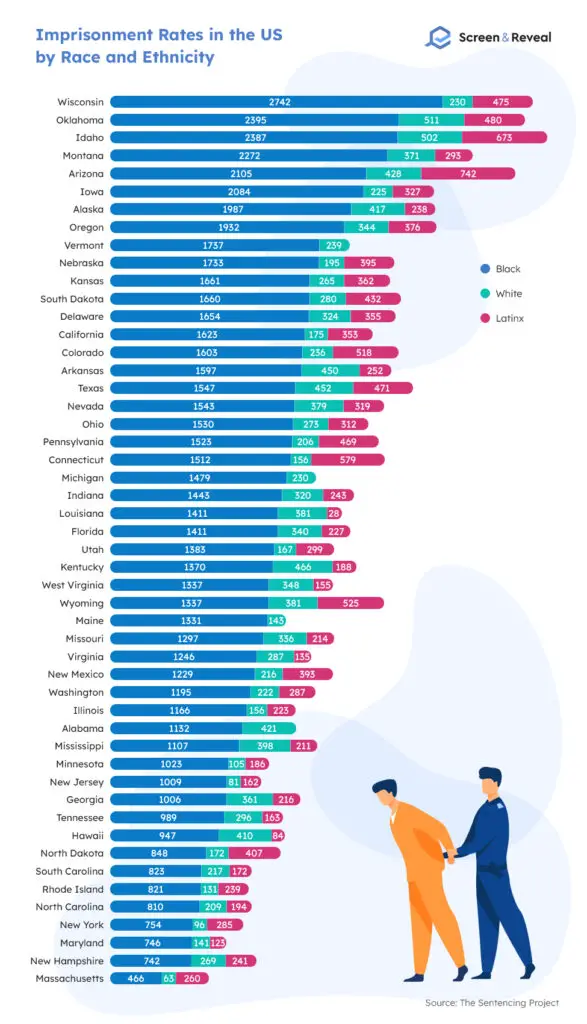
The average incarceration state rate shows that African Americans are imprisoned at a rate of 1,240 per 100,000. Whites, on the other hand, are incarcerated at a rate of 261 per 100,000, which means Blacks are incarcerated 4.8 times the rate of whites. The states with the highest African American incarceration include Wisconsin, Oklahoma, Idaho, Montana, Arizona. Incarceration stats show that even Hawaii, the state with the lowest racial disparity, has twice as high the incarceration rate for Blacks than whites.
African Americans are overrepresented in prisons throughout all states. Let’s look at imprisonment rates by race and ethnicity in Wisconsin, which tops the chart in black imprisonment. We can see that it incarcerates 2,742 Black individuals per 100,000 Black residents in state prisons, compared to 475 Latinx and 230 Whites.
If we dive deeper into incarceration statistics, more precisely into the odds of imprisonment among Black people in each state considering their overall representation in the state, the states that top the charts in African American incarceration are Wisconsin with one in 36, Oklahoma and Idaho with one in 42, Montana with one in 44, and Arizona with one in 48 Black prisoners.
(The Sentencing Project)
3. Juvenile Incarceration Statistics
- 36,479 juveniles are incarcerated in US juvenile jails and prisons on any given day. (Kids Count Data Center)
- The US juvenile custody rate is 114 per 100,000. (Kids Count Data Center)
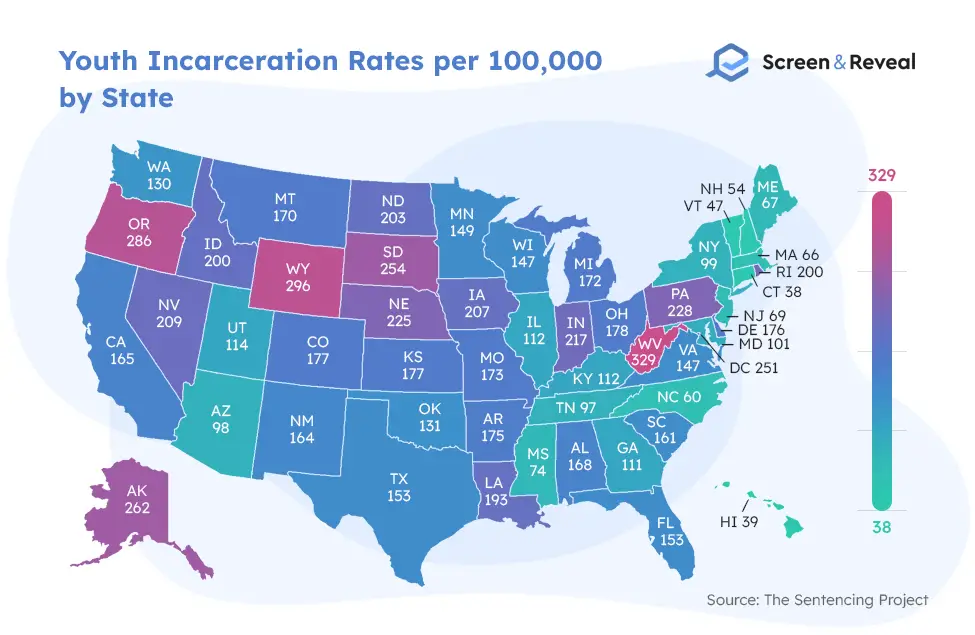
- West Virginia has the highest youth incarceration rate, with 329 per 100,000. (The Sentencing Project)
- Connecticut has the lowest youth incarceration rate, with 38 per 100,000. (The Sentencing Project)
- Youth incarceration statistics show that about 1,995 children are arrested in the US daily. (Maryville University)
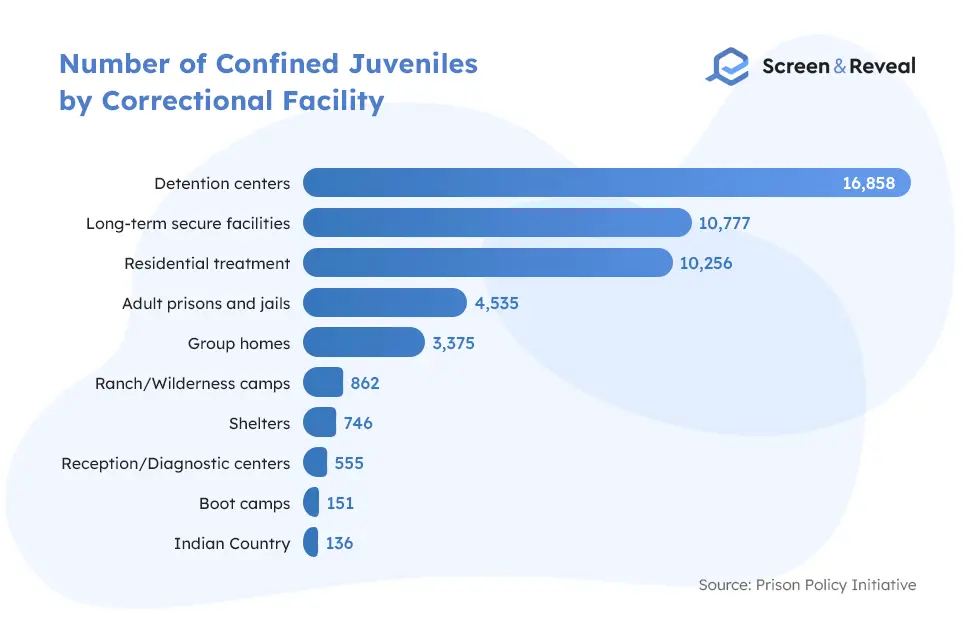
- The bulk of all confined youth (16,858) are locked in detention centers. (Prison Policy Initiative)
- 66% of youth spend more than a month in juvenile facilities. (Prison Policy Initiative)
- 24% are held for over six months. (Prison Policy Initiative)
- 8% end up staying in these facilities for over a year. (Prison Policy Initiative)
3.1. Juvenile Justice Facilities Are Much Like Real Prisons and Jails
Child incarceration statistics unveil that 92% of the youth are kept under locked conditions in juvenile facilities. Over 60% or two-thirds of confined youth are held in juvenile justice system’s equivalent to adult jails and prisons or actual adult jails or prisons. A 2018 report showed that 52% of long-term secure facilities, 44% of detention centers, and 43% of reception/diagnostic centers use “mechanical restraints,” similar to those in adult prisons. These restraints include handcuffs, leg cuffs, straitjackets, restraining chairs, etc. 40% of detention centers and long-term secure facilities leave youth in isolation, in locked rooms, sometimes for 4 hours or more.
(Prison Policy Initiative)
3.2. Juvenile Incarceration Statistics on the Most Common Offenses
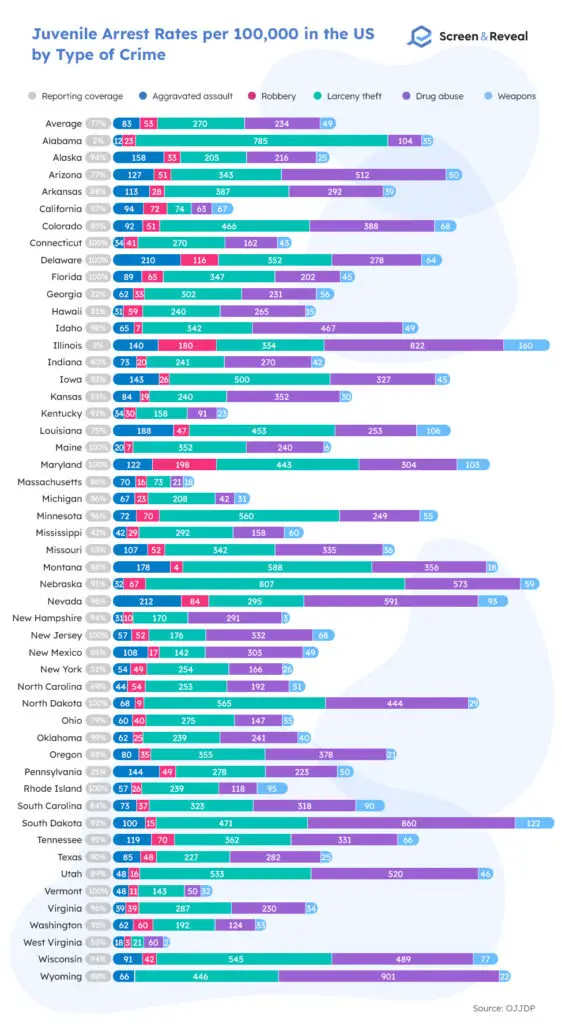
A Juvenile Court Statistics report sheds light on the top reasons for incarceration among juveniles. These offenses include simple assault (20%), drug law violations (14%), larceny (13%), obstruction of justice (12%), disorderly conduct (6%), or an attempt to perform these actions. Other dominant juvenile offenses include trespassing, vandalism, burglary, robbery, aggravated assault, and crimes related to possession or use of weapons.
(Maryville University)
4. Youth Incarceration Statistics by State
The states with the highest juvenile incarceration rates per 100,000 include West Virginia with 329, Wyoming with 296, Oregon with 286, Alaska with 262, and South Dakota with 254 per 100,000. The states that have managed to keep juvenile incarceration at a minimum are Connecticut with 38, Hawaii with 39, Vermont with 47, New Hampshire with 54, and North Carolina with 60 per 100,000.
(The Sentencing Project)
For state-level juvenile arrest rates, which are also defined by number per 100,000, data shows that the situation is quite different based on the type of violation.
4.1. Juvenile Incarceration Statistics
When it comes to age, 69% of confined youth are 16 years or older, while around 500 are younger than 12. Thousands are kept without having had a trial. Pretrial detention is quite common in the juvenile justice system, where judges detain youth in 26% of delinquency cases before they’re even tried. That brings us to over 9,500 children and teenagers locked in juvenile facilities that haven’t been found guilty or delinquent and are awaiting trial. Another 6,100 are in these facilities only because they are awaiting sentencing or placement.
While pretrial detention could be necessary in cases where youth have been involved in serious offenses and could pose a risk to the community, only half are actually accused of violent crimes. Youth incarceration statistics show that more than 3,200 individuals under 18 are detained for “behaviors that are not law violations for adults,” including status offenses and technical violations of probation or parole.
Holding juveniles, pretrial may expose them to the risk of victimization while detained and cause other issues as they’re isolated from their families and locked in prison-like conditions. Pretrial detention also occurs when families or other closely related members can’t afford to pay bail in cases where youth are transferred to the adult system. This results in youth being locked in adult facilities without having been convicted. In 2017, 40% of youth experienced pretrial detention for longer than a month, while nearly 500 have been detained for over a year.
(Prison Policy Initiative)
4.2. Child Incarceration Statistics by Race
Like in adult prisons, racial disparity is present among the incarcerated youth, with African Americans and American Indians overrepresented in juvenile facilities. Black youth comprise 14% of all youth, but their representation in juvenile facilities is quite disproportionate to their presence in the overall population. Of all youth framed in juvenile facilities, 42% are Black boys, and 35% are Black girls. American Indians make up less than 1% of all youth nationally, meaning that they are also overrepresented in juvenile facilities accounting for 3% of all girls and 1.5% of all boys.
Incarceration statistics on decisions to transfer youth from juvenile to adult court also reflect racial disparities. White youth accounted for 44% of all delinquency cases but resulted in 31% judicial transfers to adult courts. Black youth meanwhile was found responsible for 35% of delinquency cases, with 54% of those ending up being transferred from juvenile to adult court. Historically, there was a drop in cases where youth were judicially transferred in adult court from 2005 to 2017, but the racial disproportionality among these transfers is more pronounced than ever.
Racial disparity is, again, present in youth pretrial detention. Only 21% of white youth participating in delinquency actions are detained, compared to 25% of Asian, Native Hawaiian, or Pacific Islander youth, 26% of Native American youth, 30% of Black youth, and 32% of Hispanic youth.
(Prison Policy Initiative)
4.3. US Incarceration Statistics on Minor Offenses by Juveniles
While many juveniles are framed for severe offenses, a surprising number gets confined for the lowest-level offenses like not reporting to probation officers, not completing community service, running away, violating curfew, or being labeled as “ungovernable.”
For 15% of incarcerated youth, the most severe charge is a technical violation, and for 4% of youth, the most serious charge is a status offense. Yet, even these minor offenses that wouldn’t result in confinement, except for their status as probationers or minors, result in placement in the most restrictive facilities for more extended stays, in some cases 90+ days.
(Prison Policy Initiative)
4.4. Juvenile American Incarceration Statistics and Trends
The number of confined youth has dropped by 60% since 2000, thanks to reformative initiatives and changes in policy and laws. The same progress of a 60% decrease has been recorded in youth placed in adult prisons and jails. Data shows that in 1999, 107,493 juveniles resided in juvenile justice facilities, creating a rate of 355 per 100,000. As of 2019, this number has dropped by almost triple, resulting in 36,479 and a rate of 114 incarcerated youth per 100,000.
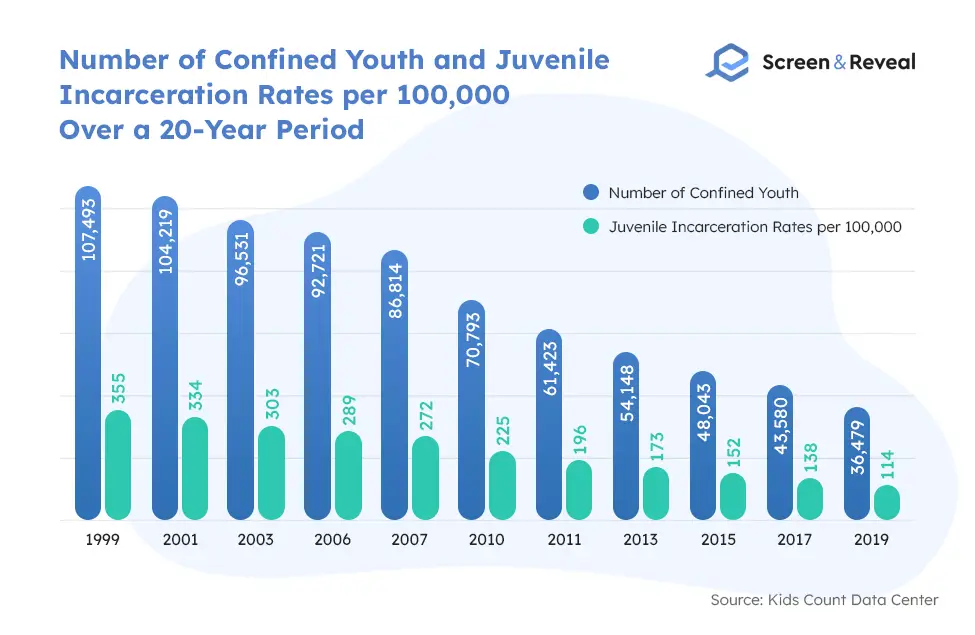
This trend has no signs of slowing down and continues to promote youth decarceration at a rate of 5% a year. As a result, almost 1,300 juvenile facilities have closed their doors, among which two-thirds of the largest institutions.
(Prison Policy Initiative, Kids Count Data Center)
5. Female Incarceration Statistics
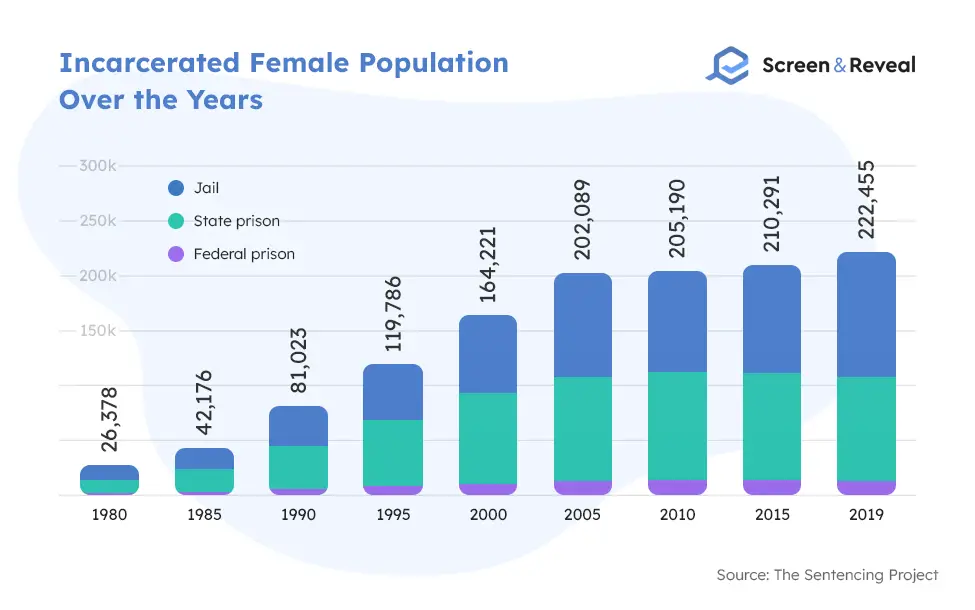
- The female prison population in the US grew by 700% between 1980 and 2019. (The Sentencing Project)
- The imprisonment rate for white women is 48 per 100,000. (The Sentencing Project)
- The incarceration rate for African American women (83 per 100,000) is 1.7 times the rate for white women. (The Sentencing Project)
- Latinas are 1.3 times (63 per 100,000) more likely to get imprisoned than white women. (The Sentencing Project)
- Women in prison statistics show that the incarceration rate for white and Latin women has increased by 41% between 2000 and 2019. (The Sentencing Project)
- The rate for Black women declined by 60% between 2000 and 2019. (The Sentencing Project)
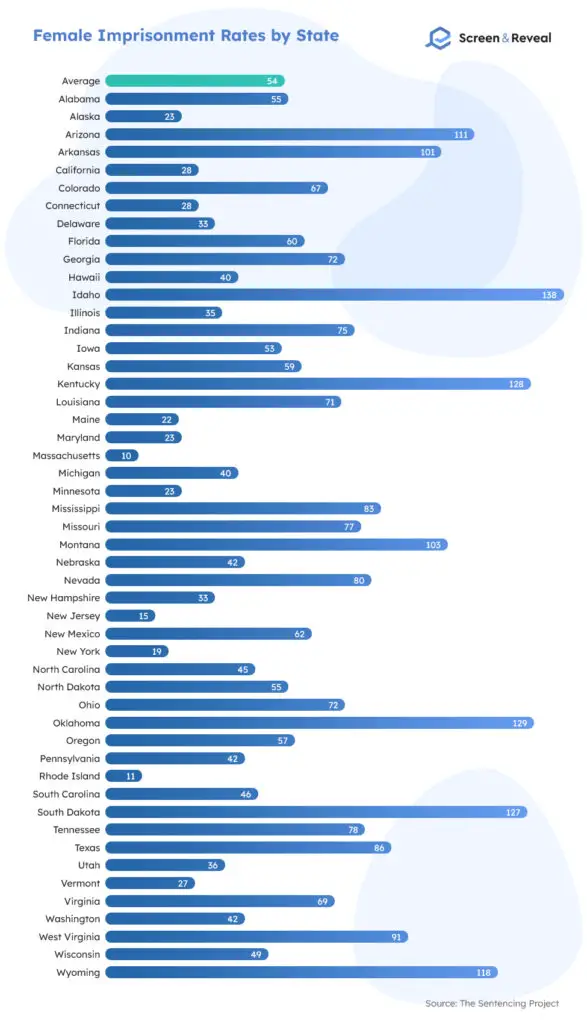
- Idaho is the state with the highest incarceration rate for women, 138 per 100,000. (The Sentencing Project)
- Massachusetts holds the lowest imprisonment rate for women, 10 per 100,000. (The Sentencing Project)
- 1.2 million women are under the supervision of the American criminal justice system. (The Sentencing Project)
- Girls account for 15% of incarcerated youth. (The Sentencing Project)
- Every year, nearly 2 million women and girls are released from jails and prisons. (Prison Policy Initiative)
5.1. Female Incarceration Stats and Trends
Although the prison population has been declining, the progress isn’t proportionally attributed to the female prison population. There are 700% more women in the US jails and prisons now than in 1980. The massive jump could be explained through a series of factors unique to women, most notably, higher post-conviction barriers.
Over 60% of women in state prisons have a child younger than 18, and more often than not, are the primary caregivers to their children, which affects their income and ability to work. Women, therefore, find it harder to afford bail, so they remain stuck in jails while awaiting trial. As a reference, the average bail often surpasses the full-year income women make.
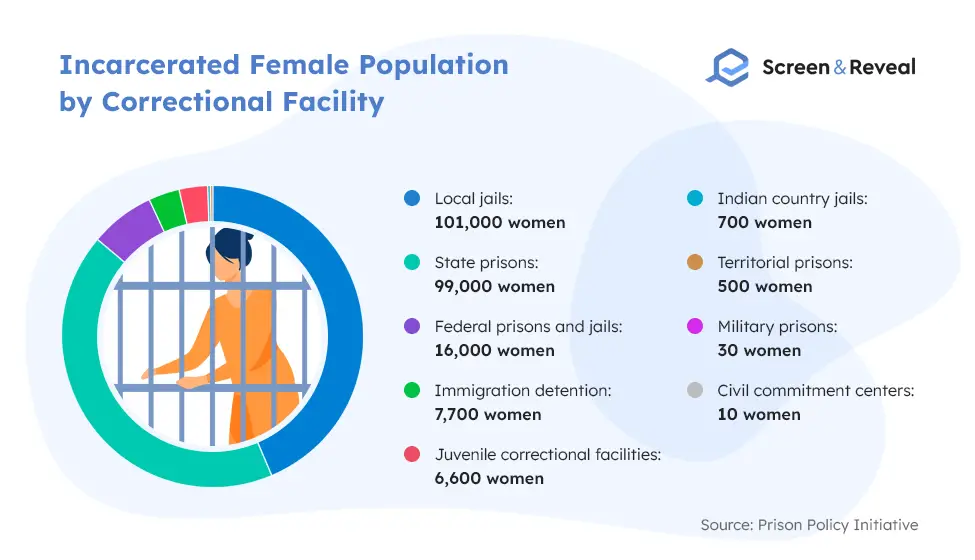
Even when convicted, about a quarter of women remain in jails, a situation that applies only to 10% of all incarcerated people after being convicted. According to female incarceration statistics, of 222,455 incarcerated women, nearly half (114,000) are held in jails. What’s the issue with jails compared to prisons? Jails are designed for shorter stays than prisons. These facilities make it hard for the imprisoned women to stay in touch with their families. Communication is often restricted to calls and postcards, as some jails don’t even allow letters. Jail calls are also three times more expensive than prison calls.
What’s more concerning is that 80% of incarcerated women are mothers. Statistics on incarceration of females suggest that the system makes it complicated and costly for them to keep in touch with their kids, which negatively affects children on many levels. Jails are also associated with a lack of mental health care. Not that mental health in prisons is effectively handled. Still, data shows that women in jails are far more likely to suffer from mental illnesses and severe psychological distress than both women in prisons and men in either prisons or other correctional facilities.
Another downfall is that women in jails have fewer post-release programs available. Since jails are not meant for long-term stays, but women end up stuck in there, they are destined to receive less, if any, adequate post-release support. This could be one reason why women are more likely to be homeless than men after release.
(The Sentencing Project, Prison Policy Initiative)
5.2. Female Incarceration Statistics on Racial and Sexual Orientation Disparities
Statistics clearly show racial disparities among women in jails, prisons, and other correctional institutions. While white women are the most represented in the overall population, they get incarcerated at a rate of 48 per 100,000, which is lower than 83 for African American women, and 63 for Latin women.
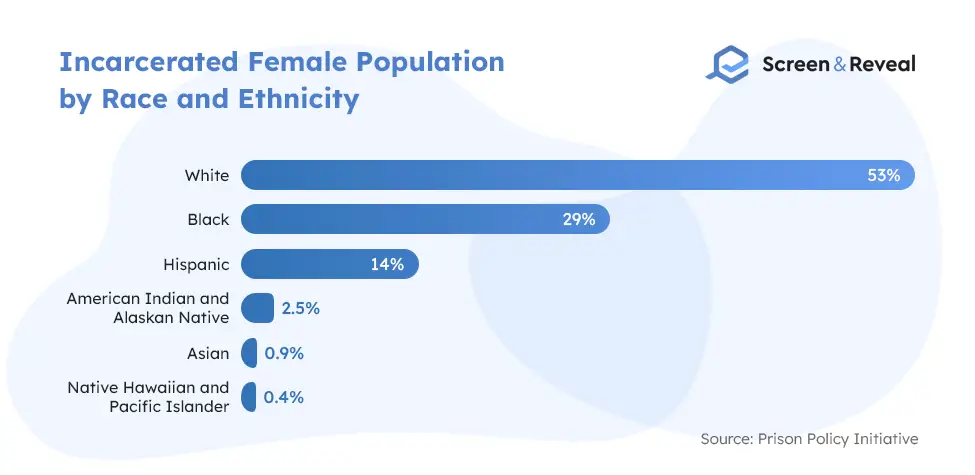
Although the imprisonment rate for African American women has declined by 60% since 2000, Black women still account for 29% of the total female prison population, which is relatively high given that they comprise only 12.9% of the total US population. Women in prison statistics indicate that most women in jails and prisons are white (53%), which is understandable considering that white women account for 60% of the total US population.
While there isn’t much data available, a recent study showed that a third of all incarcerated women are lesbian or bisexual, compared to only 10% of men who identify as gay or bisexual. The study also revealed a tendency to assign longer sentences to lesbian and bisexual women than heterosexual ones. This means that disparities in female incarceration go in two directions — racial and sexual.
(The Sentencing Project, Prison Policy Initiative)
5.3. Statistics on Women Under Supervision
Incarceration statistics show that 1.2 million women are under the supervision of the American criminal justice system, and three out of four are on probation. Albeit a milder alternative to incarceration, probation is often followed by unrealistically tricky conditions that women, especially those with childcare duties, fail to meet. Typically, women are in the worst position to afford the high fees and end up being locked up not because they committed a new crime but because they couldn’t afford to stay on probation.
As most women are primary caretakers for their children, the complicated probation requirements cause an additional burden. These women often struggle financially, making it impossible for them to hire babysitters or afford transportation from one point to another to attend meetings with probation officers.
(The Sentencing Project, Prison Policy Initiative)
6. Homelessness After Incarceration Statistics
The Prison Policy research on homelessness among the 5 million formerly incarcerated people has discovered that they are 10 times more likely to be homeless compared to the general public. Most property owners work with tenant screening companies that report applicants’ credit and criminal history, putting formerly incarcerated individuals at a disadvantage. Given that secure housing is crucial to addressing other elements like mental health issues, substance abuse, finding a stable job, and being of service to the community, this is a severe problem among formerly incarcerated people.
Both this research and national research have shown a connection between past incarceration and homelessness, discovering that 15% of incarcerated people have been homeless even in the year before entering jail or prison. People who have been imprisoned more than once, people recently released, people of color and women also face a higher rate of homelessness.
(Prison Policy Initiative)
6.1. Homelessness After Incarceration Among People Who Have Been Incarcerated More Than Once
The rate for people who have been incarcerated just once is seven times higher than the general public. Those who have been in prison multiple times, however, face a 13 times higher risk of becoming homeless than the general public, meaning they are twice as likely to end up living on the streets than their peers who have been in prison just once.
The criminalization of homelessness is yet another factor for repeated incarceration. Namely, law enforcement agencies still consider some of the survival elements of homeless people, like sleeping in public areas, panhandling, loitering, and urinating in public, as offenses that funnel formerly incarcerated homeless people back to prison.
(Prison Policy Initiative)
6.2. Homelessness After Incarceration Among Recently Released People
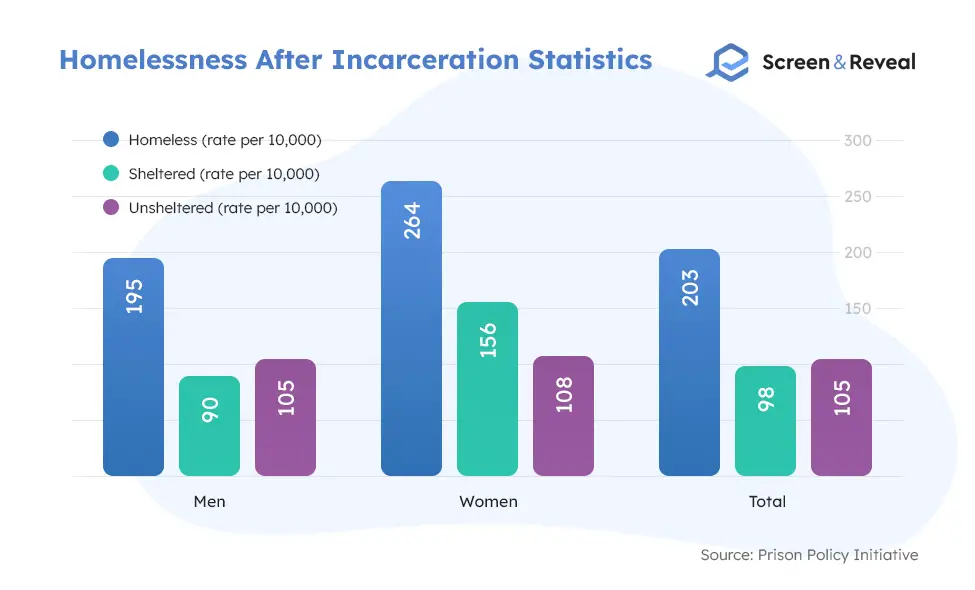
We can divide homelessness into two categories: sheltered and unsheltered. Sheltered homelessness refers to homeless people who reside in shelters, while the latter means living without a fixed residence. US incarceration statistics related to homelessness show quite significant gender differences among the formerly incarcerated homeless people. The general homelessness rate is 203 per 10,000 formerly incarcerated people.
(Prison Policy Initiative)
6.3. Gender and Racial Disparity in Homelessness Among Recently Released People
Looking at the incarceration stats related to homelessness, we can notice gender differences in homelessness after incarceration. Women, part of the former prison population, are more likely to be homeless than former male prisoners. Women, however, have a higher chance of sheltered homelessness, while men are more likely to face unsheltered homelessness for either personal choice or other reasons.
Below we dive deeper into the sheltered and unsheltered homelessness by race and gender:
- The unsheltered homelessness rate for formerly incarcerated Black people is 123 per 10,000.
- Black men experience an unsheltered homelessness rate of 124 per 10,000 formerly incarcerated Black men.
- Hispanic formerly incarcerated people experience an unsheltered homelessness rate of 90 per 10,000.
- The unsheltered homelessness rate for Hispanic men is 82 per 10,000 formerly incarcerated Hispanic men.
- Formerly incarcerated white people have an unsheltered homelessness rate of 82 per 10,000.
- Formerly incarcerated white men face an unsheltered homelessness rate of 81 per 10,000.
- The unsheltered homelessness rate for formerly incarcerated white women is 87 per 10,000.
Statistics on incarceration and homelessness suggest that formerly incarcerated Black men have greater chances to become homeless and unsheltered than white and Hispanic men.
While there’s not enough data to calculate the exact unsheltered homelessness rate for Black women and Latinas, the report shows that women of color experience a higher rate of unsheltered homelessness than white women.
(Prison Policy Initiative)
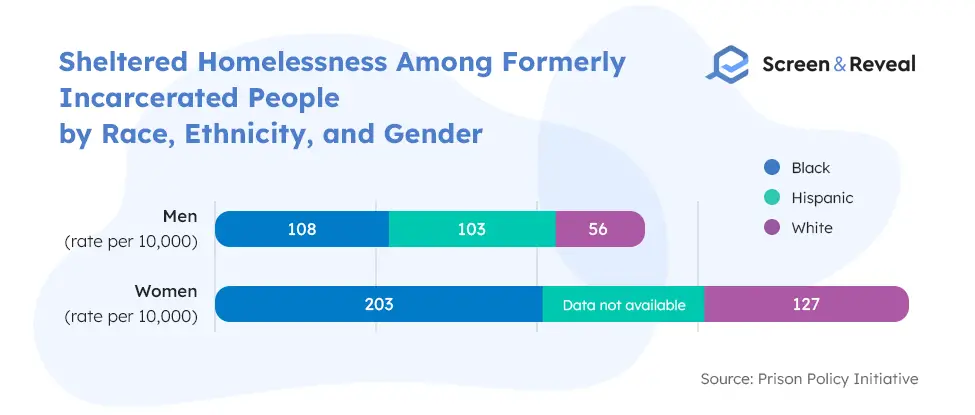
6.4. Statistics on Sheltered Homelessness by Race and Gender
Although there’s a lack of American incarceration statistics for the sheltered homelessness rate for Latin women, we can clearly see that Black women experience the highest rate of sheltered homelessness. Compared to formerly incarcerated white men, formerly incarcerated Black women are four times more likely to experience sheltered homelessness. This rate is twice as high when compared to the rate of formerly incarcerated Black men. Looking at all homelessness after incarceration statistics, it’s clear that Black women have the hardest time finding stable housing after release. Other research on gender and race disparities shows that the unemployment rates among formerly incarcerated Black women are higher than any other demographic group.
(Prison Policy Initiative)
6.5. Housing Security Rate Among Formerly Incarcerated People
To better understand the risk of homelessness among formerly incarcerated people, the Prison Policy introduced another metric in their research, dubbed housing security. This metric considers formerly incarcerated people who aren’t currently homeless but live on the verge of homelessness as their current housing solutions are far from stable. Such housing solutions include hotels, motels, and rooming houses. The rate of formerly incarcerated people living in marginal housing is 367 per 10,000. If we gather the unsheltered, sheltered, and marginal housing homelessness rates, we can see that 570 per 10,000 formerly incarcerated people face housing insecurity after release.
Homelessness and incarceration statistics further suggest that housing insecurity doesn’t affect every demographic group equally. For instance, it’s more common for men to live in marginal housing than women, meaning a higher rate of housing insecurity. Latinx live in marginal housing more than people of any other ethnicity and race, which results in a higher housing insecurity rate. In general, older formerly incarcerated people face the highest rates of housing insecurity.
(Prison Policy Initiative)
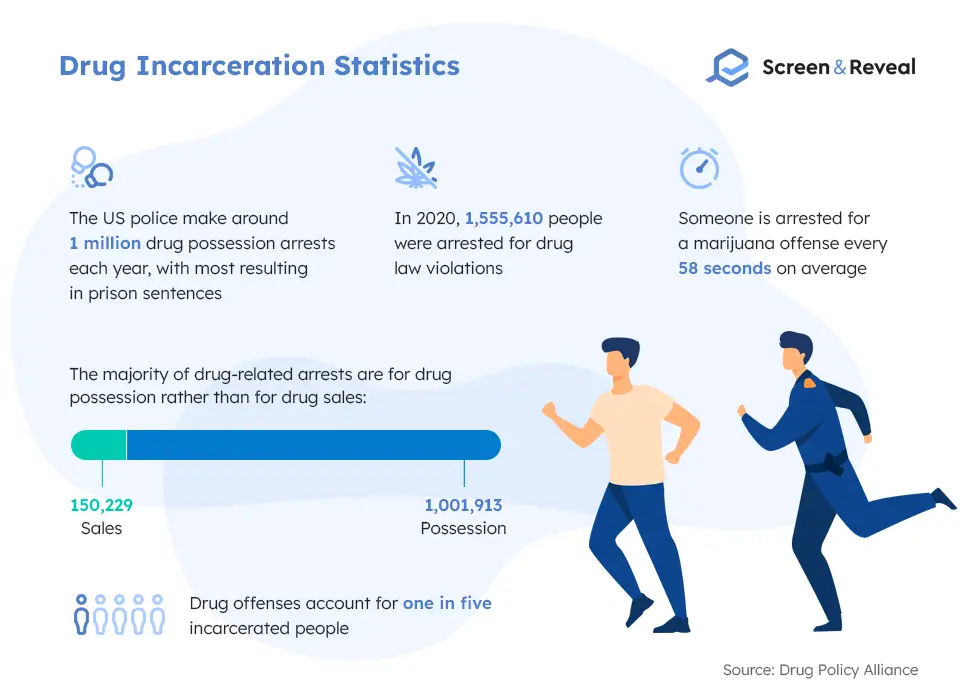
7. Drug Incarceration Statistics
On any given day, 450,000 people are incarcerated for non-violent drug offenses. It’s no wonder that employers are increasingly adopting zero-tolerance drug policies by performing pre-employment drug screening, random drug testing, and post-accident drug testing.
State prisons keep 191,000 of 450,000, while 157,000 people are incarcerated for non-violent drug offenses in local jails. US incarceration statistics show that federal prisons keep around 100,000 people for non-violent drug offenses. There are also 2,100 people held in youth facilities for drug offenses, comprising 5% of all incarcerated youth. The federal government spends roughly $9.2 million every day of the year, or over $3.3 billion annually, to imprison people for drug-related offenses.
(Prison Policy Initiative, Center for American Progress)
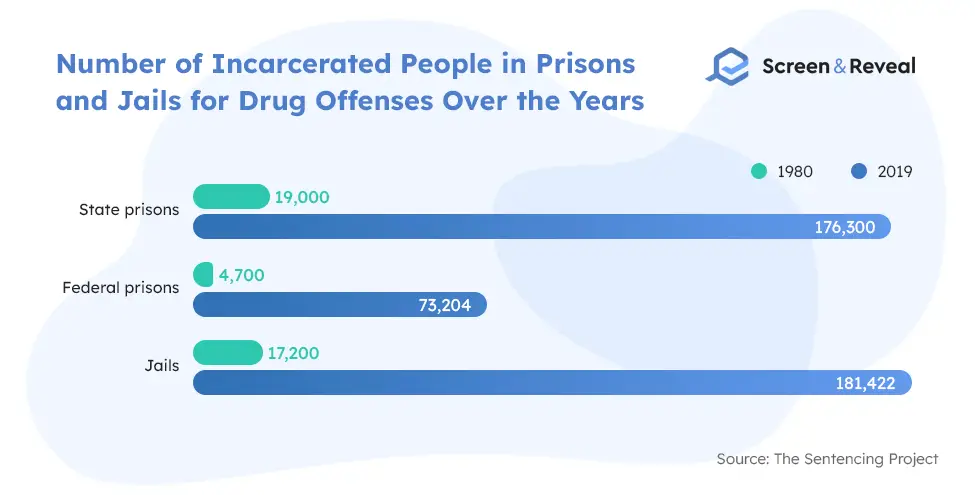
7.1. The War on Drugs Boosts Prison Population
The beginning of the War on Drugs and the “tough on crime” era in the 1980s resulted in a tremendous rise in the overall prison population from 1980 to the present, skyrocketing the number of prisoners locked up for drug-related offenses. Drug incarceration statistics reveal that the number of Americans arrested for drug possession has tripled since 1980. Today, US jails and prisons keep more people behind bars solely for drug offenses than the total number of prisoners for any crime in 1980.
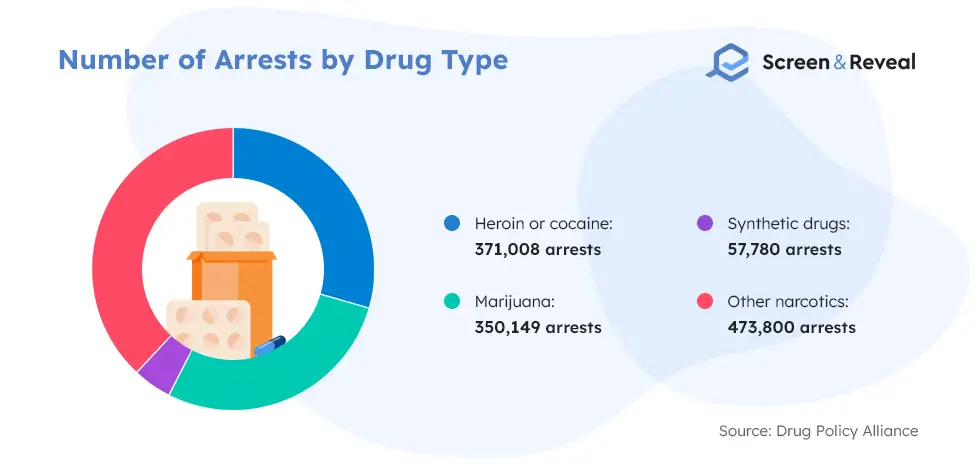
When it comes to arrests by drug type, Marijuana incarceration statistics show that in 2019, the police made 350,149 marijuana-related arrests, even more for heroin or cocaine possession and sales, and hundreds of thousands additional arrests for other drug types.
Substance abuse statistics suggest that incarcerating people for drug-related offenses has minimal impact on substance misuse rates. Namely, formerly incarcerated people are almost 13 times more likely to die than the general public during their two weeks after release. The leading cause of death is overdose. These individuals have a 129% bigger risk of dying from an overdose than the general public.
(The Sentencing Project, Drug Policy Alliance, Center for American Progress)
7.2. Race-Related Drug Incarceration Statistics
If we look at the prison population by race, we can see that people of color are disproportionately impacted by the War on Drugs. These individuals are more likely to get stopped, searched, arrested, convicted, and get a longer sentence. While racial disparities are present in most cases of incarceration, this is especially common for drug law violations. Even for possession alone, criminal record statistics show that when people end up with a lifelong criminal record, it affects their life on multiple levels. The following drug incarceration statistics shed light on the significant racial disparities that people of color face.
- Black people account for nearly 30% of all drug-related arrests but only 12.5% of all substance users.
- African Americans are four times more likely to face marijuana charges than white Americans.
- Black people are almost six times more likely to get behind bars for drug-related offenses than white peers.
- Black and Latinx account for nearly 80% of people serving time for a federal drug offense.
- People of color account for 60% of the total prison population serving time for drug offenses.
(Center for American Progress)
8. Prison Population Statistics
A whopping 2.3 million people are confined in the United States, making the largest prison population in the world. The prison population growth between 1980 and 2010 is partially due to increased time served in prison and the use of life sentences. One in nine people in prison is serving a life sentence, and a third of them don’t have the right to parole. Take a look at these staggering prison statistics:
- 1,291,000 people are locked in state prisons. (Prison Policy Initiative)
- 631,000 are held in local jails, out of which only 167,000 are convicted. (Prison Policy Initiative)
- Federal prisons and jails keep 226,000 people locked, with only 166,000 convicted. (Prison Policy Initiative)
- Nearly 44,000 youth are incarcerated in juvenile justice facilities. (Prison Policy Initiative)
- Immigration and Customs Enforcement (ICE) detains 42,000 people. (Prison Policy Initiative)
- In 2019, the imprisonment rate was at an all-time low since 1995, falling for 11 consecutive years. (BJS)
- The incarceration rate for Black Americans has fallen 29% between 2009 and 2019. (BJS)
- The imprisonment rate for Hispanic people went 24% down between 2009 and 2019. (BJS)
- Between 2009 and 2019, the incarceration rate for white people dropped by 12%. (BJS)
9. Incarceration Statistics by Crime
Of the total 2.3 million individuals confined in the US, state prisons incarcerate 1,291,000 people for a number of crimes, with more than half serving time for violent offenses and the rest being framed for property, drug, and public order-related crimes. Prison statistics show that federal prisons and jails keep 226,000 people behind bars for different offenses, out of which 166,000 are convicted, and 60,000 are held by the US Marshals Service. Data further reveals that local jails lock 631,000 people, out of which as many as 470,000 are not convicted.
(Prison Policy Initiative)
10. Poverty and Incarceration Statistics
Incarceration demographics suggest that incarcerated people of all ages, genders, and ethnic groups earned significantly less than their non-incarcerated counterparts. Two-thirds of people detained in jails made $12,000 annually before incarceration. Things get even worse after incarceration as the majority of employers work with criminal background check companies. When they discover criminal records, in most cases, they move on to the next candidate, making it challenging for formerly incarcerated people to find a stable and well-paying job.
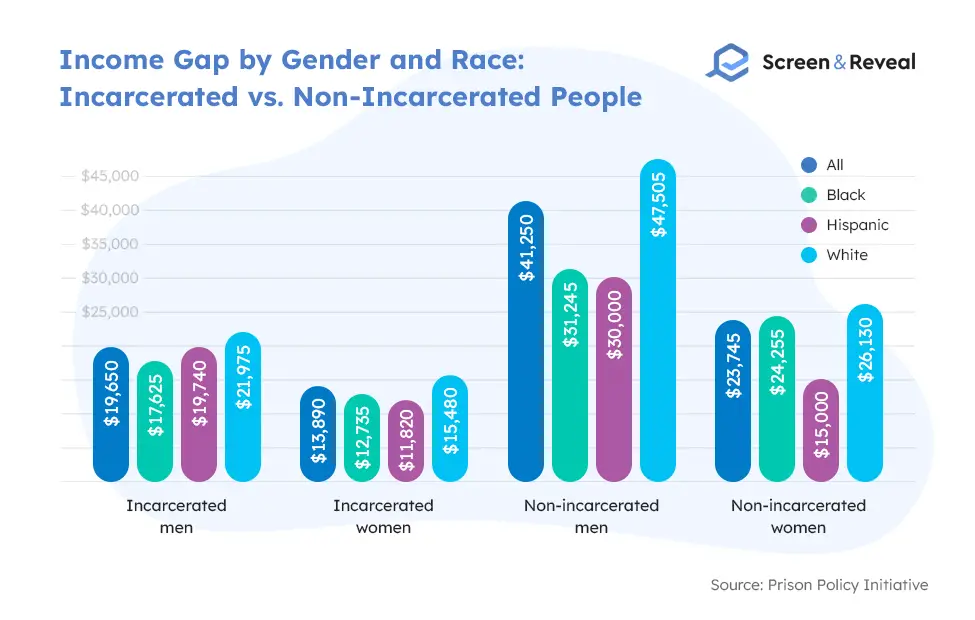
Before incarceration, white men and women earned an average annual income of $21,975 and $ 15,480, respectively. Incarceration statistics by race show that Black men and women earned the lowest median annual income prior to imprisonment, $17,625 and $12,735.
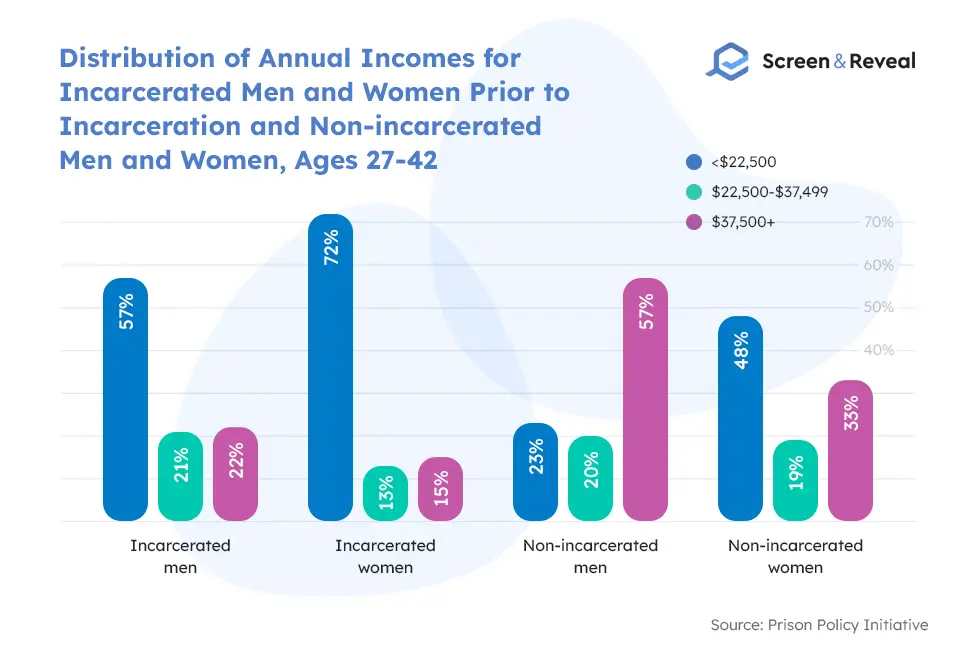
As many as 57% of incarcerated people ages 27 to 42 earned less than $22,500 annually prior to imprisonment, compared to only 23% of non-incarcerated people of the same group. Statistics on incarceration and poverty show that 21% of incarcerated men ages 27 to 42 made a median annual income between $22,500 and $37,499, compared to 20% of non-incarcerated men who belong in the same age categories and earned the same amount. The situation is even worse among women, where a staggering 72% of incarcerated women ages 27 to 42 earned on average $22,500 a year, compared to 48% of non-incarcerated women of the same group.
Poverty and incarceration stats also suggest that children raised by single parents are twice more likely to end up in prison in adulthood. Children who grow up in poverty have greater chances of developing issues that affect their impulse control, self-esteem, and ability to learn, which could later contribute to a higher likelihood of committing a crime.
(Prison Policy Initiative, MassLegalServices, American Action Forum)
10.1. The Relationship Between Mass Incarceration and Poverty
Poverty and incarceration are closely related as incarceration puts families and entire communities on the edge of survival. Families of incarcerated men, in particular, face the toughest economic challenges. Poverty and incarceration statistics suggest that families with an incarcerated father are more likely to become homeless, have difficulty meeting even the most basic needs, and often become dependent on social assistance. After release, things often don’t get much better as formerly incarcerated people face employment discrimination, unstable housing, and lack of post-release support leading to poverty, and in most cases, reoffending.
- Poverty and incarceration statistics unveil that 65 million Americans or one in four adults have a criminal record that might show up in an employee background check. Data shows that if someone with an identical resume but without a criminal record applies for the job, the person with a criminal record has significantly lower chances of getting hired. (NELP)
- Some types of criminal records strip formerly incarcerated people from the eligibility to receive cash assistance, housing assistance, and SNAP (food stamps), which, combined with the hardship to find a job, makes it almost impossible for people to exit the vicious cycle of poverty. (MassLegalServices)
- Statistics on incarceration and poverty show that nearly one-fourth of all incarcerated people are held before trial, mainly because they can’t afford bail. On top of that, bail amounts show a consecutive rise over the years. (American Action Forum)
- Most people belonging to the bottom 20% of income distribution can’t afford to pay the bail bond premium for average bail, typically accounting for 10% of the total bail amount, let alone cover the entire bail itself. (American Action Forum)
11. Wrongful Incarceration Statistics
- Since 1989, there have been 2,880 exonerations in the US. (The National Registry of Exonerations)
- 1989 brought the lowest number of exonerations, 24, while in 2016, exonerations reached an all-time high of 181. (The National Registry of Exonerations)
- The highest number of exonerations (399) is registered in Texas, followed by Illinois with 359, New York with 316, and California with 255, American incarceration statistics show. (The National Registry of Exonerations)
- New Hampshire has the lowest number of exonerations, two, followed by Vermont with three. (The National Registry of Exonerations)
- According to wrongful incarceration statistics, wrongly convicted people in the US have spent a combined 25,874 years behind bars. (The National Registry of Exonerations)
- The average case lost nine years of their life due to false accusations and wrongful convictions. (The National Registry of Exonerations)
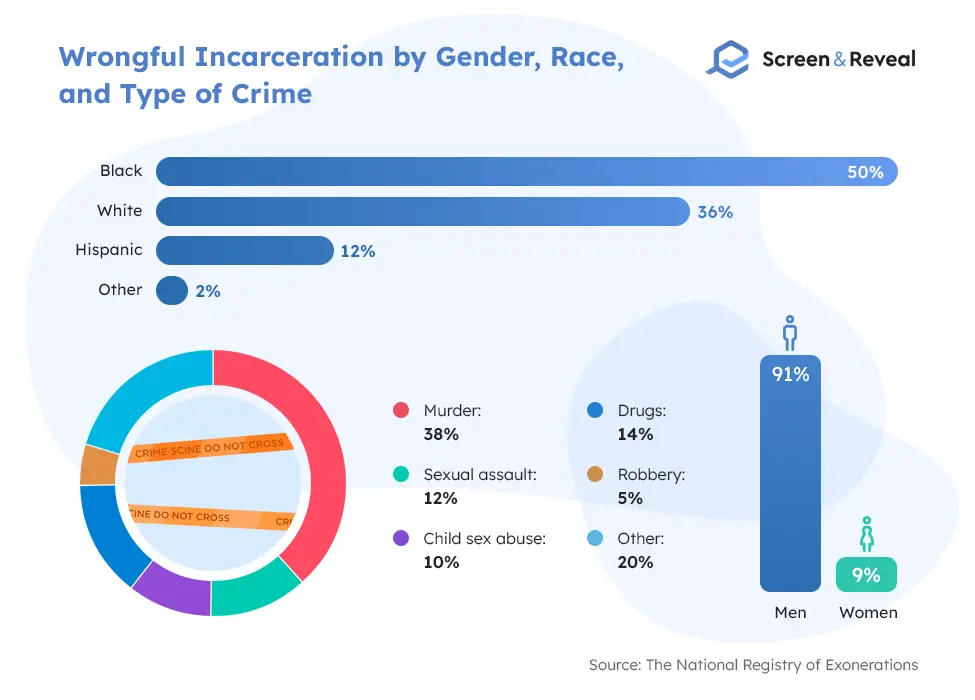
- Murder exonerations are the most common, accounting for 38% of all exoneration cases. (The National Registry of Exonerations)
- Black Americans have accounted for 50% of all exoneration cases since 1989. (The National Registry of Exonerations)
- Wrongful incarceration statistics show that of all exonerees, 91% are male. (The National Registry of Exonerations)
- According to the National Academy of Sciences, the “conservative estimate of the proportion of false conviction among death sentences in the United States” is 4.1%. (The University of Michigan Law School)
- Sex offenders stats show that strangers comprise only one-fifth of all sexual assaults on women but make 71% of false convictions that later result in exoneration. (The University of Michigan Law School)
- Non-violent convictions account for over 80% of felony convictions but only less than 20% of exonerations. (The University of Michigan Law School)
11.1. Racial Disparity Among Wrongly Incarcerated People
Black Americans comprise only 13% of the American population. Still, they are most likely to get wrongfully convicted and exonerated. As of 2021, out of the 2,880 exonerations in the National Registry of Exonerations, African Americans accounted for 50%. Whites, on the other hand, comprise 64% of the total US population but account for only 36% of exonerations. (The National Registry of Exonerations)
- Wrongful incarceration statistics by race suggest that innocent Black Americans are seven times more likely to get wrongfully convicted for murder than innocent whites, mainly due to the higher homicide rates in black communities. These cases often result in falsely accusing innocent defendants. (The University of Michigan Law School)
- Sexual assault statistics show that Black prisoners convicted of sexual assault are 3.5 times more likely to be innocent than white peers serving time for the same crime. Data suggests that these wrongful convictions are often a result of mistaken eyewitness identifications in violent cases involving white victims and black assailants. (The University of Michigan Law School)
- Since 1989, over 1,800 individuals involved in high-profile police scandals related to drug crimes that never occurred have been cleared in “group exonerations.” The majority of these people were African American. (The University of Michigan Law School)
- Wrongful incarceration statistics suggest that Black sexual assault exonerees spend significantly longer time behind bars (13.3 years) than their white counterparts (8.9 years). (The University of Michigan Law School)
- Of the 25 sexual assault exonerees who spent 25 years or longer in prison, including five locked between 30 to 35 years, 88% were black. (The University of Michigan Law School)
- African American sexual assault exonerees typically receive longer and harsher sentences than their white counterparts. In sexual assault cases, 28% of Blacks received life sentences compared to 17% of whites. Of those not sentenced to life, the average minimum term for Blacks was 29 years, compared to 19 years for whites. (The University of Michigan Law School)
- Black defendants account for 55% of drug crime exonerations, compared to 24% involving white defendants. Not only are Black Americans five times more likely to get arrested for drug possession, but innocent African Americans are 12 times more likely to get wrongly convicted than white people. (The University of Michigan Law School)
12. Mental Illness and Incarceration Statistics
- In 44 US states, a jail or a prison keeps more mentally ill people than the largest state psychiatric hospital. (Treatment Advocacy Center)
- Half of the prisoners report at least some concerns related to mental illnesses. (American Psychological Association)
- In 2014, roughly 20% of people locked in jails and 15% of inmates in prisons were estimated to have a severe mental illness. That totals 383,000 people who suffer from severe mental illness issues locked by the justice system. This compares to about 5% of the total US population diagnosed with severe mental illness. (Treatment Advocacy Center)
- There are only around 38,000 patients with serious mental illness in state hospitals. Mental illness and incarceration statistics suggest that the number of people with severe mental conditions locked in prisons and jails is ten times the number of mental illness patients in the nation’s state hospitals. (Treatment Advocacy Center)
- According to the 2018 report of the Bureau of Justice Statistics, 14% of the incarcerated in federal and state facilities and 26% in local jails meet the criteria for having severe psychiatric diseases. (Prison Legal News)
- Mental illness affects a higher percentage of females than male prisoners. (Prison Legal News)
- People with mental illnesses like schizophrenia and bipolar disorder are ten times more likely to get behind bars than hospital beds. (Treatment Advocacy Center)
- Incarceration statistics show people with serious mental illness remain longer behind bars than people without, mainly because these individuals have more challenges understanding and following jail and prison rules. (Treatment Advocacy Center)
- Federal data suggests that a whopping 40% of prisoners were diagnosed with mental health disorders between 2011 and 2014. (Prison Legal News)
- Mental illness and incarceration statistics by the National Alliance of Mental Illness suggest that nearly two million people with psychological problems get framed every year. (Prison Legal News)
- Mentally ill prisoners cost more to keep locked. For instance, in Michigan, it costs $95,000 a year to house each mentally ill prisoner, compared to $35,000 a year for each without mental illness. The country spends on average $6,000 on non-incarcerated mentally ill individuals. (Prison Legal News)
- Mentally ill prisoners are more likely to commit suicide than those who don’t have mental disorders. Suicide is the leading cause of death among prisoners. Data shows that half of the suicides are committed by inmates with mental illness. (Treatment Advocacy Center)
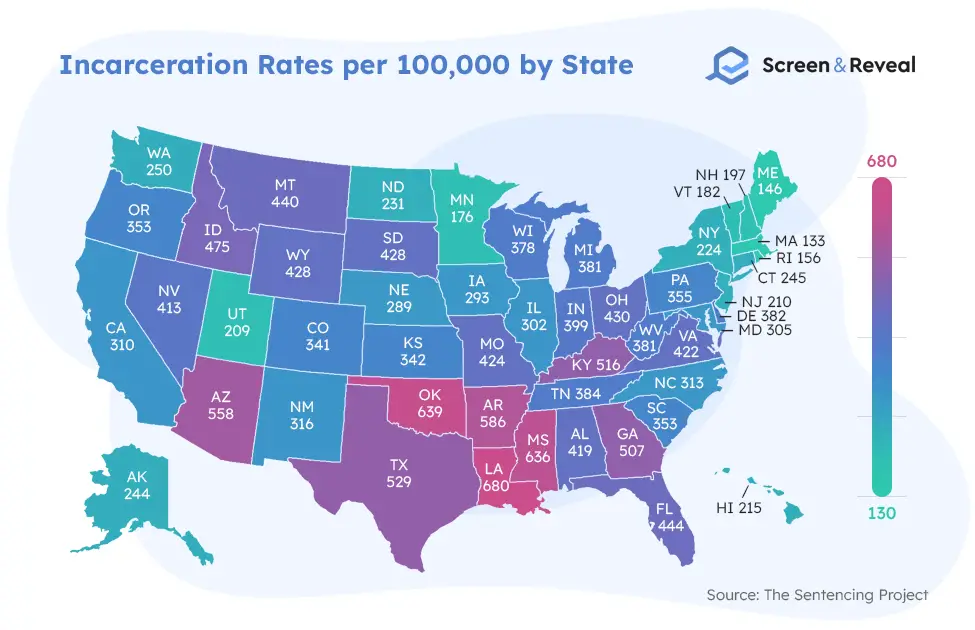
13. Incarceration Statistics by State
More populous countries might have more significant prison populations. That’s why it’s essential to look at the state imprisonment rate and where a particular state ranks among other states in the US.
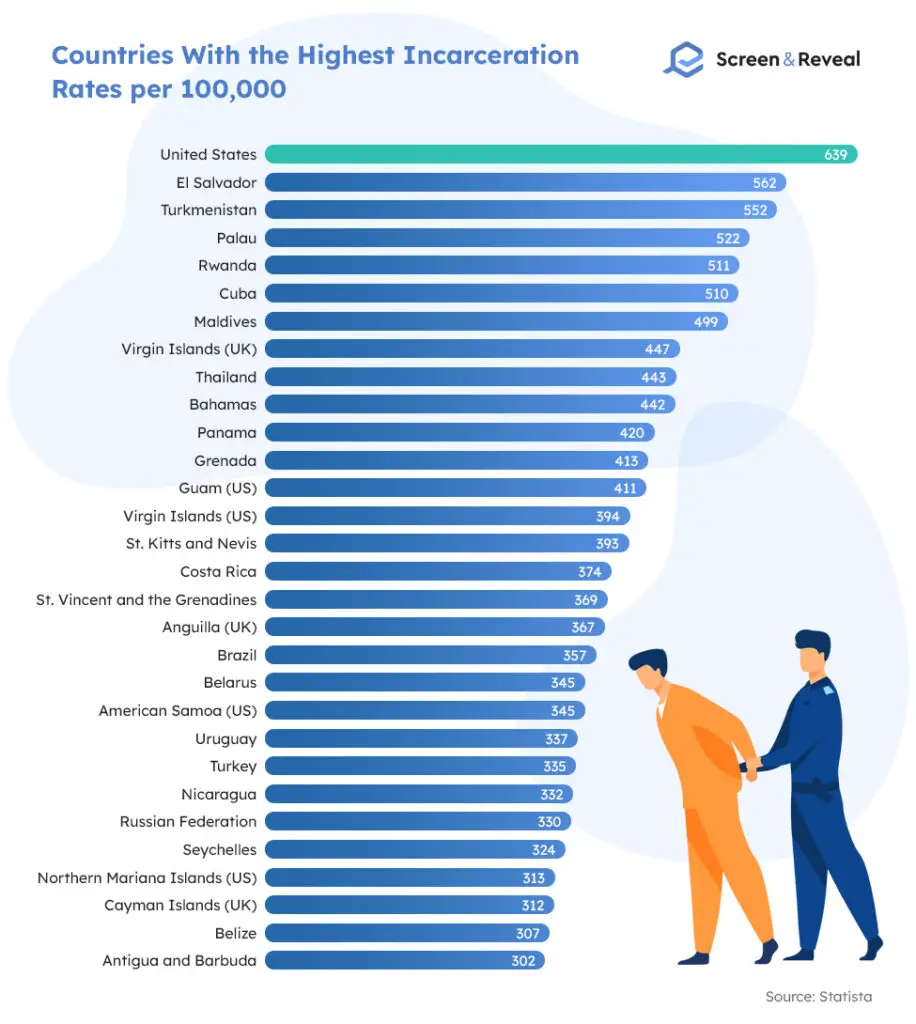
14. Incarceration Statistics by Country
For years, the US has remained a leader among the countries with the highest incarceration rates. Other leading incarcerators globally include El Salvador, Turkmenistan, and Palau.
(Statista)
Incarceration FAQ:
What percentage of the population is incarcerated?
American incarceration statistics show that about 0.7% of the US population is locked in federal or state prisons or local jails. While it might seem like an insignificant portion of the total population, it actually accounts for almost 2.3 million people.
(Prison Policy Initiative)
What is the rate of incarceration in the United States?
The incarceration rate in the United States is 639 per 100,000.
(Statista)
What country has the highest incarceration rate?
The United States has the highest incarceration rate globally, keeping 639 people locked per 100,000.
(Statista)
What state has the highest incarceration rate?
Louisiana is the state with the highest imprisonment rate, 680 per 100,000.
(The Sentencing Project)
What country has the lowest incarceration rate?
Incarceration statistics by country show that the Central African Republic is the country with the lowest incarceration rate, with only 16 people in prison for every 100,000.
(Guinness World Records)
What percentage of felons are violent?
Data shows that over 55% of incarcerated people are serving sentences for violent offenses.
(BJS)
How many felons commit crimes again?
Two reports that monitored long-term recidivism among released inmates from state and federal prisons show that high arrest rates continue to follow formerly convicted individuals. In the nine-year study period, 83% of state prisoners have committed crimes again. For released prisoners from federal prisons, the rates are 64% for violent and 39.8% for non-violent federal prisoners.
(Prison Legal News)
Does probation reduce recidivism?
While more accurate incarceration statistics have yet to be presented on this topic, a few studies have uncovered that emphatic and skilled probation officers can significantly reduce recidivism through probation supervision.
(US Courts)
What crime has the highest rate of recidivism?
Felony offenses could be divided into nine main categories: murder, manslaughter, assault, drug, property, sex, robbery, burglary, and other felonies. With 74.2%, other felonies have the highest recidivism rate, followed by property crimes with 66.4% and robbery with 65%.
(Washington State Caseload Forecast Council)
How many prisoners in the US have a mental illness?
According to 2014 mental illness and incarceration statistics, about 20% of people in jails and 15% of people in prisons were identified as individuals with a severe mental illness, translating into 383,000 inmates with severe mental health issues. Data from 2018 suggests that the percentage of people with mental illness in local jails has reached 26%, while 14% of the incarcerated in federal and state prisons are mentally ill.
(Treatment Advocacy Center)
How many juveniles are incarcerated in the US?
Incarceration statistics show that the US keeps 36,479 juveniles locked in juvenile justice facilities on any given day.
(Kids Count Data Center)
What is the most common crime committed by juveniles?
Larceny or theft is one of the top reasons for incarceration among youth.
(Global Youth Justice)
Sources: Brennan Center for Justice, The Sentencing Project, Prison Policy Initiative, The Sentencing Project, The Sentencing Project, Kids Count Data Center, The Sentencing Project, Maryville University, Prison Policy Initiative, OJJDP, The Sentencing Project, Prison Policy Initiative, Prison Policy Initiative, Prison Policy Initiative, Center for American Progress, Drug Policy Alliance, BJS, Prison Policy Initiative, MassLegalServices, American Action Forum, NELP, The National Registry of Exonerations, The University of Michigan Law School, Treatment Advocacy Center, American Psychological Association, Prison Legal News, Statista, Guinness World Records, BJS, Prison Legal News, US Courts, Washington State Caseload Forecast Council, Global Youth Justice.